 RSS Feed
 by Calculated Risk on 4/19/2024 07:11:00 PM
Friday, April 19, 2024
April 19th COVID Update: Weekly Deaths Decreased
 Note: Mortgage rates are from MortgageNewsDaily.com and are for top tier scenarios.
It is likely that we will see pandemic lows for hospitalizations and deaths in the next several weeks. That is welcome news!
For deaths, I'm currently using 4 weeks ago for "now", since the most recent three weeks will be revised significantly.
Hospitalizations have declined significantly from the winter high of 30,027 but are still slightly above the low of 5,386 last year.
| COVID Metrics | ||||
|---|---|---|---|---|
| Now | Week Ago | Goal | ||
| Hospitalized2 | 5,899 | 6,686 | ≤3,0001 | |
| Deaths per Week2 | 779 | 982 | ≤3501 | |
| 1my goals to stop weekly posts, 2Weekly for Currently Hospitalized, and Deaths 🚩 Increasing number weekly for Hospitalized and Deaths ✅ Goal met. | ||||
 Click on graph for larger image.
This graph shows the weekly (columns) number of deaths reported.
Weekly deaths have declined sharply from the recent peak of 2,558 but are still 50% above the low of 490 last July.
 This appears to be a leading indicator for COVID hospitalizations and deaths.
Nationally, COVID in wastewater is now off close to 90% from the holiday peak at the end of December, and that suggests weekly hospitalizations and deaths will continue to decline.
Q1 GDP Tracking: Movin' on Up
by Calculated Risk on 4/19/2024 11:31:00 AM
From BofA:
Since our update last week, 1Q GDP tracking is up two-tenths to 2.1% q/q saar. [Apr 19th estimate]From Goldman:
emphasis added
We left our Q1 GDP forecast unchanged at +3.1% (qoq ar) and our domestic final sales forecast also unchanged at +3.1% (qoq ar). [Apr 18th estimate]And from the Altanta Fed: GDPNow
The GDPNow model estimate for real GDP growth (seasonally adjusted annual rate) in the first quarter of 2024 is 2.9 percent on April 16, up from 2.8 percent on April 15. [April 16th estimate]
NMHC: "Apartment Market Continues to Loosen"
by Calculated Risk on 4/19/2024 08:10:00 AM
Today, in the CalculatedRisk Real Estate Newsletter: NMHC: "Apartment Market Continues to Loosen"
Excerpt:
From the NMHC: Apartment Market Continues to Loosen Amidst Worsening Financing ConditionsThere is much more in the article.Apartment market conditions continued to weaken in the National Multifamily Housing Council’s (NMHC’s) Quarterly Survey of Apartment Market Conditions for April 2024. With the exception of Sales Volume (52), which turned positive this quarter, the Market Tightness (41), Equity Financing (49), and Debt Financing (44) indexes all came in below the breakeven level (50).
...
"[T]he U.S. apartment market continues to absorb historic levels of new supply, resulting in rising vacancy rates and decreasing rent growth.”
...• The Market Tightness Index came in at 41 this quarter – below the breakeven level (50) – indicating looser market conditions for the seventh consecutive quarter. That said, a plurality of respondents (42%) thought market conditions were unchanged compared to three months ago, while 37% thought markets have become looser. Twenty percent of respondents reported tighter markets than three months ago, up from 5% in January.The quarterly index increased to 41 in April from 23 in January. Any reading below 50 indicates looser conditions from the previous quarter.
This index has been an excellent leading indicator for rents and vacancy rates, and this suggests higher vacancy rates and a further weakness in asking rents. This is the seventh consecutive quarter with looser conditions than the previous quarter.

Thursday, April 18, 2024
Hotels: Occupancy Rate Increased 2.8% Year-over-year
by Calculated Risk on 4/18/2024 06:11:00 PM
Helped by the total solar eclipse, U.S. hotel performance increased from the previous week, according to CoStar’s latest data through 13 April. ...The following graph shows the seasonal pattern for the hotel occupancy rate using the four-week average.
7-13 April 2024 (percentage change from comparable week in 2023):
• Occupancy: 65.8% (+2.8%)
• Average daily rate (ADR): US$160.20 (+2.9%)
• Revenue per available room (RevPAR): US$105.48 (+5.8%)
emphasis added
 Click on graph for larger image.
The red line is for 2024, black is 2020, blue is the median, and dashed light blue is for 2023. Dashed purple is for 2018, the record year for hotel occupancy.
The 4-week average of the occupancy rate is tracking last year, and also at the median rate for the period 2000 through 2023 (Blue).
Note: Y-axis doesn't start at zero to better show the seasonal change.
The 4-week average of the occupancy rate will move mostly sideways seasonally until the summer travel season.
Realtor.com Reports Active Inventory UP 29.1% YoY; New Listings Up 7.2% YoY
by Calculated Risk on 4/18/2024 02:01:00 PM
What this means: On a weekly basis, Realtor.com reports the year-over-year change in active inventory and new listings. On a monthly basis, they report total inventory. For March, Realtor.com reported inventory was up 23.5% YoY, but still down almost 38% compared to March 2017 to 2019 levels.
Now - on a weekly basis - inventory is up 29.1% YoY.
Realtor.com has monthly and weekly data on the existing home market. Here is their weekly report: Weekly Housing Trends View—Data Week Ending April 13, 2024 Here is a graph of the year-over-year change in inventory according to realtor.com.
Inventory was up year-over-year for the 23rd consecutive week following 20 consecutive weeks with a YoY decrease in inventory.
Realtor.com has monthly and weekly data on the existing home market. Here is their weekly report: Weekly Housing Trends View—Data Week Ending April 13, 2024
• Active inventory increased, with for-sale homes 29.1% above year-ago levels.
For the 23rd week in a row, there were more homes listed for sale compared with the previous year, giving homebuyers a wider selection to choose from. However, this week’s increase was not as high as the 30.4% growth seen last week, possibly suggesting a slowdown in inventory growth. This could be due to the continued impact of high mortgage rates, which might be discouraging some sellers from listing their homes.
• New listings–a measure of sellers putting homes up for sale–were up this week, by 7.2% from one year ago.
Following some ups and downs around Easter, sellers kept putting homes on the market at a faster rate compared with last year, with a 7.2% increase in newly listed homes. However, this growth rate is slower than what we’ve seen since early February.
 Here is a graph of the year-over-year change in inventory according to realtor.com.
 Inventory was up year-over-year for the 23rd consecutive week following 20 consecutive weeks with a YoY decrease in inventory.
Inventory is still historically very low.
New listings remain below typical pre-pandemic levels although increasing.
NAR: Existing-Home Sales Decreased to 4.19 million SAAR in March; Median House Prices Increased 4.8% Year-over-Year
by Calculated Risk on 4/18/2024 10:40:00 AM
Today, in the CalculatedRisk Real Estate Newsletter: NAR: Existing-Home Sales Decreased to 4.19 million SAAR in March
Excerpt:
Sales Year-over-Year and Not Seasonally Adjusted (NSA)There is much more in the article.
The fourth graph shows existing home sales by month for 2023 and 2024.
Sales declined 3.7% year-over-year compared to March 2023. This was the thirty-first consecutive month with sales down year-over-year.

NAR: Existing-Home Sales Decreased to 4.19 million SAAR in March
by Calculated Risk on 4/18/2024 10:00:00 AM
From the NAR: Existing-Home Sales Descended 4.3% in March
Existing-home sales slipped in March, according to the National Association of REALTORS®. Among the four major U.S. regions, sales slid in the Midwest, South and West, but rose in the Northeast for the first time since November 2023. Year-over-year, sales decreased in all regions.
Total existing-home sales – completed transactions that include single-family homes, townhomes, condominiums and co-ops – receded 4.3% from February to a seasonally adjusted annual rate of 4.19 million in March. Year-over-year, sales waned 3.7% (down from 4.35 million in March 2023).
...
Total housing inventory registered at the end of March was 1.11 million units, up 4.7% from February and 14.4% from one year ago (970,000). Unsold inventory sits at a 3.2-month supply at the current sales pace, up from 2.9 months in February and 2.7 months in March 2023.
emphasis added
 Click on graph for larger image.
This graph shows existing home sales, on a Seasonally Adjusted Annual Rate (SAAR) basis since 1994.
Sales in March (4.19 million SAAR) were down 4.3% from the previous month and were 3.7% below the March 2023 sales rate.
The second graph shows nationwide inventory for existing homes.
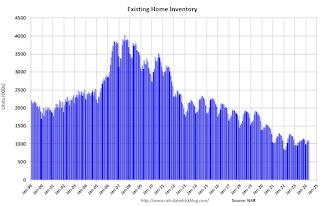 According to the NAR, inventory increased to 1.11 million in March from 1.06 million the previous month.
 According to the NAR, inventory increased to 1.11 million in March from 1.06 million the previous month.
Headline inventory is not seasonally adjusted, and inventory usually decreases to the seasonal lows in December and January, and peaks in mid-to-late summer.
The last graph shows the year-over-year (YoY) change in reported existing home inventory and months-of-supply. Since inventory is not seasonally adjusted, it really helps to look at the YoY change. Note: Months-of-supply is based on the seasonally adjusted sales and not seasonally adjusted inventory.
 Inventory was up 14.4% year-over-year (blue) in March compared to March 2023.
Months of supply (red) increased to 3.2 months in March from 2.9 months the previous month.
This was at the consensus forecast. I'll have more later.
The last graph shows the year-over-year (YoY) change in reported existing home inventory and months-of-supply. Since inventory is not seasonally adjusted, it really helps to look at the YoY change. Note: Months-of-supply is based on the seasonally adjusted sales and not seasonally adjusted inventory.
 Inventory was up 14.4% year-over-year (blue) in March compared to March 2023.
 Months of supply (red) increased to 3.2 months in March from 2.9 months the previous month.
This was at the consensus forecast. I'll have more later.
Weekly Initial Unemployment Claims Unchanged at 212,000
by Calculated Risk on 4/18/2024 08:30:00 AM
The DOL reported:
In the week ending April 13, the advance figure for seasonally adjusted initial claims was 212,000, unchanged from the previous week's revised level. The previous week's level was revised up by 1,000 from 211,000 to 212,000. The 4-week moving average was 214,500, unchanged from the previous week's revised average. The previous week's average was revised up by 250 from 214,250 to 214,500.The following graph shows the 4-week moving average of weekly claims since 1971.
emphasis added
 Click on graph for larger image.
The dashed line on the graph is the current 4-week average. The four-week average of weekly unemployment claims decreased to 214,500.
The previous week was revised up.
Weekly claims were lower than the consensus forecast.
Wednesday, April 17, 2024
Thursday: Unemployment Claims, Philly Fed Mfg, Existing Home Sales
by Calculated Risk on 4/17/2024 08:23:00 PM
 Note: Mortgage rates are from MortgageNewsDaily.com and are for top tier scenarios.
Thursday:
• At 8:30 AM ET, The initial weekly unemployment claims report will be released. The consensus is for 217 thousand initial claims, up from 211 thousand last week.
• Also at 8:30 AM, the Philly Fed manufacturing survey for April. The consensus is for a reading of 0.0, down from 3.2.
• At 10:00 AM, Existing Home Sales for March from the National Association of Realtors (NAR). The consensus is for 4.20 million SAAR, down from 4.38 million.
4th Look at Local Housing Markets in March; California Home Sales Down 4.4% YoY in March
by Calculated Risk on 4/17/2024 04:21:00 PM
Today, in the Calculated Risk Real Estate Newsletter: 4th Look at Local Housing Markets in March; California Home Sales Down 4.4% YoY in March
A brief excerpt:
The NAR is scheduled to release March existing home sales tomorrow, Thursday, April 18th at 10:00AM ET. The consensus is for 4.20 million SAAR, down from 4.38 million in February.There is much more in the article.
Housing economist Tom Lawler expects the NAR to report sales of 4.23 million SAAR for March.
...
And a table of March sales.
In March, sales in these markets were down 9.7% YoY. In February, these same markets were up 1.6% year-over-year Not Seasonally Adjusted (NSA).
Sales in most of these markets are down compared to 2019.
This is a year-over-year decrease NSA for these early reporting markets. However, there were two fewer working days in March 2024 compared to March 2023, so sales Seasonally Adjusted will be higher year-over-year than Not Seasonally Adjusted sales.
...
More local markets will release data after the NAR release tomorrow!


