 RSS Feed
 by Calculated Risk on 5/31/2024 09:48:00 AM
Friday, May 31, 2024
Fannie and Freddie: Single Family Serious Delinquency Rate Decreased in April, Multi-family Increased Slightly
Today, in the Calculated Risk Real Estate Newsletter: Fannie and Freddie: Single Family Serious Delinquency Rate Decreased in April, Multi-family Increased Slightly
Brief excerpt:
Single-family serious delinquencies decreased in April, and multi-family serious delinquencies increased slightly.
...
Freddie Mac reports that the multi-family delinquencies rate increased to 0.35% in April, up from 0.34% in March, and down from 0.44% in January.
This graph shows the Freddie multi-family serious delinquency rate since 2012. Rates were still high in 2012 following the housing bust and financial crisis.
The multi-family rate increased following the pandemic and has increased recently as rent growth has slowed, vacancy rates have increased, and borrowing rates have increased sharply. The rate surged higher in January but declined in February and March. This will be something to watch as more apartments come on the market.

There is much more in the article.
PCE Measure of Shelter Slows to 5.6% YoY in April
by Calculated Risk on 5/31/2024 08:57:00 AM
Here is a graph of the year-over-year change in shelter from the CPI report and housing from the PCE report this morning, both through April 2024.
 CPI Shelter was up 5.5% year-over-year in April, down from 5.6% in March, and down from the cycle peak of 8.2% in March 2023.
Housing (PCE) was up 5.6% YoY in April, down from 5.8% in March, and down from the cycle peak of 8.3% in April 2023.
Since asking rents are mostly flat year-over-year, these measures will continue to slow over the next year.
Since asking rents are mostly flat year-over-year, these measures will continue to slow over the next year.
 The second graph shows PCE prices, Core PCE prices and Core ex-housing over the last 6 months (annualized):
Key measures are above the Fed's target on a 6-month basis. Note: There appears to be some residual seasonality distorting PCE, especially in January.
Personal Income increased 0.3% in April; Spending increased 0.2%
by Calculated Risk on 5/31/2024 08:30:00 AM
The BEA released the Personal Income and Outlays report for April:
Personal income increased $65.3 billion (0.3 percent at a monthly rate) in April, according to estimates released today by the Bureau of Economic Analysis. Disposable personal income (DPI) —personal income less personal current taxes—increased $40.2 billion and personal consumption expenditures (PCE) increased $39.1 billion.The April PCE price index increased 2.7 percent year-over-year (YoY), unchanged from 2.7 percent YoY in March, and down from the recent peak of 7.0 percent in June 2022.
The PCE price index increased 0.3 percent. Excluding food and energy, the PCE price index increased 0.2 percent. Real DPI decreased 0.1 percent in April and real PCE decreased 0.1 percent; goods decreased 0.4 percent and services increased 0.1 percent.
emphasis added
The PCE price index, excluding food and energy, increased 2.8 percent YoY, unchanged from 2.8 percent in March, and down from the recent peak of 5.4 percent in February 2022.
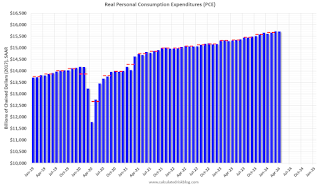
The following graph shows real Personal Consumption Expenditures (PCE) through April 2024 (2017 dollars). Note that the y-axis doesn't start at zero to better show the change.
 Click on graph for larger image.
The dashed red lines are the quarterly levels for real PCE.
Personal income was at expectations, and PCE was below expectations.
Inflation was at expectations.
Thursday, May 30, 2024
Friday: Personal Income and Outlays
by Calculated Risk on 5/30/2024 08:09:00 PM
 Note: Mortgage rates are from MortgageNewsDaily.com and are for top tier scenarios.
Friday:
• At 8:30 AM ET, Personal Income and Outlays, April 2024. The consensus is for a 0.3% increase in personal income, and for a 0.3% increase in personal spending. And for the Core PCE price index to increase 0.3%. PCE prices are expected to be up 2.7% YoY, and core PCE prices up 2.8% YoY.
• At 9:45 AM, Chicago Purchasing Managers Index for May.
Realtor.com Reports Active Inventory Up 36.5% YoY; Most Homes For Sale Since July 2020
by Calculated Risk on 5/30/2024 02:35:00 PM
What this means: On a weekly basis, Realtor.com reports the year-over-year change in active inventory and new listings. On a monthly basis, they report total inventory. For April, Realtor.com reported inventory was up 30.4% YoY, but still down almost 36% compared to April 2017 to 2019 levels.
Now - on a weekly basis - inventory is up 36.5% YoY.
Realtor.com has monthly and weekly data on the existing home market. Here is their weekly report: Weekly Housing Trends View—Data for Week Ending May 25, 2024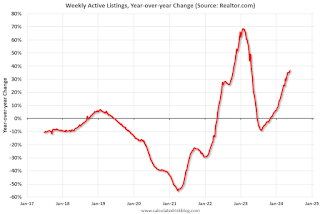 Here is a graph of the year-over-year change in inventory according to realtor.com.
Inventory was up year-over-year for the 29th consecutive week.
Realtor.com has monthly and weekly data on the existing home market. Here is their weekly report: Weekly Housing Trends View—Data for Week Ending May 25, 2024
• Active inventory increased, with for-sale homes 36.5% above year-ago levels.
For the 29th straight week, there were more homes listed for sale versus the prior year, giving homebuyers more options. This past week, the inventory of homes for sale grew by 36.5% compared with last year, and it was the highest since July 2020 in the early days of the COVID-19 Pandemic. This growth in inventory is primarily driven by housing markets in the South, which saw a 43.0% year-over-year increase in inventory in April.
• New listings–a measure of sellers putting homes up for sale–were up this week, by 3.6% from one year ago.
Seller activity continued to climb annually last week but decelerated relative to the previous week’s growth. Newly listed homes grew by 3.6% compared with a year ago, a slowdown from the 8.1% growth rate in the previous week.
 Here is a graph of the year-over-year change in inventory according to realtor.com.
 Inventory was up year-over-year for the 29th consecutive week.
However, inventory is still historically very low.
New listings remain below typical pre-pandemic levels although up year-over-year.
Final Look at Local Housing Markets in April and a Look Ahead to May Sales
by Calculated Risk on 5/30/2024 11:25:00 AM
Today, in the Calculated Risk Real Estate Newsletter: Final Look at Local Housing Markets in April and a Look Ahead to May Sales
A brief excerpt:
In April, sales in these markets were up 7.6% YoY. In March, these same markets were down 10.0% year-over-year Not Seasonally Adjusted (NSA).There is much more in the article.
Sales in most of these markets are down compared to January 2019. Sales in Grand Rapids and Nashville are up compared to 2019.
This is a year-over-year increase NSA for these markets. However, there were two more working days in April 2024 compared to April 2023, so sales Seasonally Adjusted were lower year-over-year than Not Seasonally Adjusted sales.
This was a 7.6% year-over-year decrease NSA for these markets. This is about the same as the 6.8% decline NSA reported by the NAR.
May sales will be mostly for contracts signed in March and April and mortgage rates increased slightly to an average of 6.99% in April. My early expectation is we will see a sales decrease in May on a seasonally adjusted annual rate basis (SAAR) compared to April.
Note for next month (May sales): There were the same number of working days in May 2024 compared to May 2023, so the year-over-year change in the seasonally adjusted sales will be about the same as the NSA data suggests.

NAR: Pending Home Sales Decrease 7.7% in April; Down 7.4% Year-over-year
by Calculated Risk on 5/30/2024 10:00:00 AM
From the NAR: Pending Home Sales Slumped 7.7% in April
Pending home sales in April fell 7.7%, according to the National Association of REALTORS®. All four U.S. regions registered month-over-month and year-over-year decreases.This was well below expectations. Note: Contract signings usually lead sales by about 45 to 60 days, so this would usually be for closed sales in May and June.
The Pending Home Sales Index (PHSI)* – a forward-looking indicator of home sales based on contract signings – decreased to 72.3 in April. Year over year, pending transactions were down 7.4%. An index of 100 is equal to the level of contract activity in 2001.
...
The Northeast PHSI fell 3.5% from last month to 62.9, a decline of 3.1% from April 2023. The Midwest index dropped 9.5% to 70.7 in April, down 8.7% from one year ago.
The South PHSI lowered 7.6% to 88.6 in April, dropping 8.2% from the prior year. The West index decreased 8.5% in April to 55.9, down 7.3% from April 2023.
emphasis added
Q1 GDP Growth Revised Down to 1.3% Annual Rate
by Calculated Risk on 5/30/2024 08:35:00 AM
From the BEA: Gross Domestic Product, First Quarter 2024 (Second Estimate) and Corporate Profits (Preliminary)
Real gross domestic product (GDP) increased at an annual rate of 1.3 percent in the first quarter of 2024, according to the "second" estimate released by the Bureau of Economic Analysis. In the fourth quarter of 2023, real GDP increased 3.4 percent.Here is a Comparison of Second and Advance Estimates. PCE growth was revised down from 2.5% to 2.0%. Residential investment was revised up from 13.9% to 15.4%.
The GDP estimate released today is based on more complete source data than were available for the "advance" estimate issued last month. In the advance estimate, the increase in real GDP was 1.6 percent. The update primarily reflected a downward revision to consumer spending (refer to "Updates to GDP").
The increase in real GDP primarily reflected increases in consumer spending, residential fixed investment, nonresidential fixed investment, and state and local government spending that were partly offset by a decrease in private inventory investment. Imports, which are a subtraction in the calculation of GDP, increased.
emphasis added
Weekly Initial Unemployment Claims Increase to 219,000
by Calculated Risk on 5/30/2024 08:30:00 AM
The DOL reported:
In the week ending May 25, the advance figure for seasonally adjusted initial claims was 219,000, an increase of 3,000 from the previous week's revised level. The previous week's level was revised up by 1,000 from 215,000 to 216,000. The 4-week moving average was 222,500, an increase of 2,500 from the previous week's revised average. The previous week's average was revised up by 250 from 219,750 to 220,000.The following graph shows the 4-week moving average of weekly claims since 1971.
emphasis added
 Click on graph for larger image.
The dashed line on the graph is the current 4-week average. The four-week average of weekly unemployment claims increased to 222,500.
The previous week was revised up.
Weekly claims were higher close to the consensus forecast.
Wednesday, May 29, 2024
Thursday: GDP, Unemployment Claims, Pending Home Sales
by Calculated Risk on 5/29/2024 08:02:00 PM
 Note: Mortgage rates are from MortgageNewsDaily.com and are for top tier scenarios.
Thursday:
• At 8:30 AM ET, The initial weekly unemployment claims report will be released. The consensus is for 218 thousand initial claims, up from 215 thousand last week.
• Also at 8:30 AM, Gross Domestic Product, 1st quarter 2023 (Second estimate). The consensus is that real GDP increased 1.2% annualized in Q1, down from the advance estimate of 1.6%.
• At 10:00 AM, Pending Home Sales Index for April. The consensus is for a 0.6% decrease in the index.


