 RSS Feed
 by Calculated Risk on 4/17/2024 08:23:00 PM
Wednesday, April 17, 2024
Thursday: Unemployment Claims, Philly Fed Mfg, Existing Home Sales
 Note: Mortgage rates are from MortgageNewsDaily.com and are for top tier scenarios.
Thursday:
• At 8:30 AM ET, The initial weekly unemployment claims report will be released. The consensus is for 217 thousand initial claims, up from 211 thousand last week.
• Also at 8:30 AM, the Philly Fed manufacturing survey for April. The consensus is for a reading of 0.0, down from 3.2.
• At 10:00 AM, Existing Home Sales for March from the National Association of Realtors (NAR). The consensus is for 4.20 million SAAR, down from 4.38 million.
4th Look at Local Housing Markets in March; California Home Sales Down 4.4% YoY in March
by Calculated Risk on 4/17/2024 04:21:00 PM
Today, in the Calculated Risk Real Estate Newsletter: 4th Look at Local Housing Markets in March; California Home Sales Down 4.4% YoY in March
A brief excerpt:
The NAR is scheduled to release March existing home sales tomorrow, Thursday, April 18th at 10:00AM ET. The consensus is for 4.20 million SAAR, down from 4.38 million in February.There is much more in the article.
Housing economist Tom Lawler expects the NAR to report sales of 4.23 million SAAR for March.
...
And a table of March sales.
In March, sales in these markets were down 9.7% YoY. In February, these same markets were up 1.6% year-over-year Not Seasonally Adjusted (NSA).
Sales in most of these markets are down compared to 2019.
This is a year-over-year decrease NSA for these early reporting markets. However, there were two fewer working days in March 2024 compared to March 2023, so sales Seasonally Adjusted will be higher year-over-year than Not Seasonally Adjusted sales.
...
More local markets will release data after the NAR release tomorrow!

Fed's Beige Book: "Economic activity expanded slightly"
by Calculated Risk on 4/17/2024 02:00:00 PM
Overall economic activity expanded slightly, on balance, since late February. Ten out of twelve Districts experienced either slight or modest economic growth—up from eight in the previous report, while the other two reported no changes in activity. Consumer spending barely increased overall, but reports were quite mixed across Districts and spending categories. Several reports mentioned weakness in discretionary spending, as consumers' price sensitivity remained elevated. Auto spending was buoyed notably in some Districts by improved inventories and dealer incentives, but sales remained sluggish in other Districts. Tourism activity increased modestly, on average, but reports varied widely. Manufacturing activity declined slightly, as only three Districts reported growth in that sector. Contacts reported slight increases in nonfinancial services activity, on average, and bank lending was roughly flat overall. Residential construction increased a little, on average, and home sales strengthened in most Districts. In contrast, nonresidential construction was flat, and commercial real estate leasing fell slightly. The economic outlook among contacts was cautiously optimistic, on balance.
Labor Markets
Employment rose at a slight pace overall, with nine Districts reporting very slow to modest increases, and the remaining three Districts reporting no changes in employment. Most Districts noted increases in labor supply and in the quality of job applicants. Several Districts reported improved retention of employees, and others pointed to staff reductions at some firms. Despite the improvements in labor supply, many Districts described persistent shortages of qualified applicants for certain positions, including machinists, trades workers, and hospitality workers. Wages grew at a moderate pace in eight Districts, with the remaining four noting only slight to modest wage increases. Multiple Districts said that annual wage growth rates had recently returned to their historical averages. On balance, contacts expected that labor demand and supply would remain relatively stable, with modest further job gains and continued moderation of wage growth back to pre-pandemic levels.
Prices
Price increases were modest, on average, running at about the same pace as in the last report. Disruptions in the Red Sea and the collapse of Baltimore's Key Bridge caused some shipping delays but so far did not lead to widespread price increases.
emphasis added
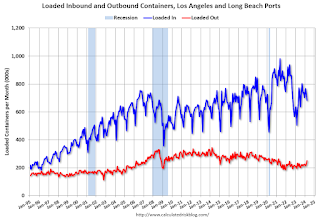
LA Port Traffic Increased Year-over-year in March
by Calculated Risk on 4/17/2024 01:41:00 PM
Container traffic gives us an idea about the volume of goods being exported and imported - and usually some hints about the trade report since LA area ports handle about 40% of the nation's container port traffic.
The following graphs are for inbound and outbound traffic at the ports of Los Angeles and Long Beach in TEUs (TEUs: 20-foot equivalent units or 20-foot-long cargo container).
To remove the strong seasonal component for inbound traffic, the first graph shows the rolling 12-month average.
 Click on graph for larger image.
On a rolling 12-month basis, inbound traffic increased 1.0% in March compared to the rolling 12 months ending in February. Outbound traffic increased 0.7% compared to the rolling 12 months ending the previous month.
The 2nd graph is the monthly data (with a strong seasonal pattern for imports).
 Usually imports peak in the July to October period as retailers import goods for the Christmas holiday, and then decline sharply and bottom in the Winter depending on the timing of the Chinese New Year.
 Usually imports peak in the July to October period as retailers import goods for the Christmas holiday, and then decline sharply and bottom in the Winter depending on the timing of the Chinese New Year.
 Imports were up 14% YoY in March, and exports were up 8% YoY.
In general, it appears port traffic is returning to the pre-pandemic patterns.
MBA: Mortgage Applications Increased in Weekly Survey
by Calculated Risk on 4/17/2024 07:00:00 AM
From the MBA: Mortgage Applications Increase in Latest MBA Weekly Survey
Mortgage applications increased 3.3 percent from one week earlier, according to data from the Mortgage Bankers Association’s (MBA) Weekly Mortgage Applications Survey for the week ending April 12, 2024.
The Market Composite Index, a measure of mortgage loan application volume, increased 3.3 percent on a seasonally adjusted basis from one week earlier. On an unadjusted basis, the Index increased 4 percent compared with the previous week. The Refinance Index increased 0.5 percent from the previous week and was 11 percent higher than the same week one year ago. The seasonally adjusted Purchase Index increased 5 percent from one week earlier. The unadjusted Purchase Index increased 6 percent compared with the previous week and was 10 percent lower than the same week one year ago.
“Rates increased for the second consecutive week, driven by incoming data indicating that the economy remains strong and inflation is proving tougher to bring down. Mortgage rates increased across the board, with the 30-year fixed rate at 7.13 percent – reaching its highest level since December 2023,” said Joel Kan, MBA’s Vice President and Deputy Chief Economist. “Despite these higher rates, application activity picked up, possibly as some borrowers decided to act in case rates continue to rise. Purchase applications drove most of the increase, but remain at low levels of around 10 percent behind last year’s pace. Refinance applications increased very slightly, driven by a 3 percent gain in conventional applications.”
...
The average contract interest rate for 30-year fixed-rate mortgages with conforming loan balances ($766,550 or less) increased to 7.13 percent from 7.01 percent, with points increasing to 0.65 from 0.59 (including the origination fee) for 80 percent loan-to-value ratio (LTV) loans.
emphasis added
 Click on graph for larger image.
The first graph shows the MBA mortgage purchase index.
According to the MBA, purchase activity is down 10% year-over-year unadjusted.
Red is a four-week average (blue is weekly).
Purchase application activity is up slightly from the lows in late October 2023, and below the lowest levels during the housing bust.

The second graph shows the refinance index since 1990.
With higher mortgage rates, the refinance index declined sharply in 2022, and has mostly flat lined since then.
Tuesday, April 16, 2024
Wednesday: Beige Book
by Calculated Risk on 4/16/2024 09:11:00 PM
 Note: Mortgage rates are from MortgageNewsDaily.com and are for top tier scenarios.
Wednesday:
• At 7:00 AM ET, The Mortgage Bankers Association (MBA) will release the results for the mortgage purchase applications index.
• At 2:00 PM, the Federal Reserve Beige Book, an informal review by the Federal Reserve Banks of current economic conditions in their Districts.
Lawler: Early Read on Existing Home Sales in March
by Calculated Risk on 4/16/2024 03:50:00 PM
Today, in the Calculated Risk Real Estate Newsletter: Lawler: Early Read on Existing Home Sales in March
A brief excerpt:
From housing economist Tom Lawler:Based on publicly-available local realtor/MLS reports released across the country through today, I project that existing home sales as estimated by the National Association of Realtors ran at a seasonally adjusted annual rate of 4.23 million in March, down 3.4% from February’s preliminary pace and down 2.8% from last ’s March’s seasonally adjusted pace. Unadjusted sales should show a larger YOY decline, as there were two fewer business days this March compared to last March.CR Note: The NAR is scheduled to release March existing home sales on Thursday, April 18th. The consensus is for 4.20 million SAAR, down from 4.38 million in February.
Local realtor/MLS reports suggest that the median existing single-family home sales price last month was up by about 6% from last March.
Single Family Starts Up 22% Year-over-year in March; Multi-Family Starts Down Sharply
by Calculated Risk on 4/16/2024 10:17:00 AM
Today, in the Calculated Risk Real Estate Newsletter: Single Family Starts Up 22% Year-over-year in March; Multi-Family Starts Down Sharply
A brief excerpt:
Total housing starts in March were well below expectations, however, starts in January and February were revised up.
The third graph shows the month-to-month comparison for total starts between 2023 (blue) and 2024 (red).
Total starts were down 4.3% in March compared to March 2023.
Starts were down year-over-year (YoY) in March following 4 consecutive months with starts up YoY. The YoY decline is due to the sharp decrease in multi-family starts.

Industrial Production Increased 0.4% in March
by Calculated Risk on 4/16/2024 09:15:00 AM
From the Fed: Industrial Production and Capacity Utilization
Industrial production rose 0.4 percent in March but declined at an annual rate of 1.8 percent in the first quarter. Manufacturing output increased 0.5 percent in March, boosted in part by a gain of 3.1 percent in motor vehicles and parts; factory output excluding motor vehicles and parts moved up 0.3 percent. The index for mining fell 1.4 percent, and the index for utilities gained 2 percent. At 102.7 percent of its 2017 average, total industrial production in March was unchanged compared with its year-earlier level. Capacity utilization moved up to 78.4 percent in March, a rate that is 1.2 percentage points below its long-run (1972–2023) average.
emphasis added
 Click on graph for larger image.
This graph shows Capacity Utilization. This series is up from the record low set in April 2020, and above the level in February 2020 (pre-pandemic).
Capacity utilization at 78.4% is 1.2% below the average from 1972 to 2022. This was below consensus expectations.
Note: y-axis doesn't start at zero to better show the change.
 The second graph shows industrial production since 1967.
Industrial production increased to 102.7. This is above the pre-pandemic level.
Industrial production was at consensus expectations.
Housing Starts Decreased to 1.321 million Annual Rate in March
by Calculated Risk on 4/16/2024 08:30:00 AM
From the Census Bureau: Permits, Starts and Completions
Housing Starts:
Privately‐owned housing starts in March were at a seasonally adjusted annual rate of 1,321,000. This is 14.7 percent below the revised February estimate of 1,549,000 and is 4.3 percent below the March 2023 rate of 1,380,000. Single‐family housing starts in March were at a rate of 1,022,000; this is 12.4 percent below the revised February figure of 1,167,000. The March rate for units in buildings with five units or more was 290,000.
Building Permits:
Privately‐owned housing units authorized by building permits in March were at a seasonally adjusted annual rate of 1,458,000. This is 4.3 percent below the revised February rate of 1,523,000, but is 1.5 percent above the March 2023 rate of 1,437,000. Single‐family authorizations in March were at a rate of 973,000; this is 5.7 percent below the revised February figure of 1,032,000. Authorizations of units in buildings with five units or more were at a rate of 433,000 in March.
emphasis added
 Click on graph for larger image.
The first graph shows single and multi-family housing starts since 2000.
Multi-family starts (blue, 2+ units) decreased in March compared to February. Multi-family starts were down 44.3% year-over-year in March.
Single-family starts (red) decreased in March and were up 21.2% year-over-year.
 The second graph shows single and multi-family housing starts since 1968.
 This shows the huge collapse following the housing bubble, and then the eventual recovery - and the recent collapse and recovery in single-family starts.
Total housing starts in March were well below expectations, however, starts in January and February were revised up.
I'll have more later …


