 RSS Feed
 by Calculated Risk on 5/08/2024 07:57:00 PM
Wednesday, May 08, 2024
Thursday: Unemployment Claims
 Note: Mortgage rates are from MortgageNewsDaily.com and are for top tier scenarios.
Thursday:
• At 8:30 AM ET, The initial weekly unemployment claims report will be released. The consensus is for 206 thousand initial claims, down from 208 thousand last week.
Leading Index for Commercial Real Estate Increased 6% in April
by Calculated Risk on 5/08/2024 02:53:00 PM
From Dodge Data Analytics: Dodge Momentum Index Rose 6% in April
The Dodge Momentum Index (DMI), issued by Dodge Construction Network, increased 6.1% in April to 173.9 (2000=100) from the revised March reading of 164.0. Over the month, commercial planning improved 12.6% and institutional planning dropped 6.3%.
“The Dodge Momentum Index (DMI) saw positive progress in April, alongside a deluge of data center projects that entered the planning stage,” stated Sarah Martin, associate director of forecasting at Dodge Construction Network. “Outsized demand to build Cloud and AI infrastructure is supporting above-average activity in the sector. Most other categories, however, faced slower growth over the month. Across these industries, it’s likely that owners and developers are grappling with uncertainty around interest rates and labor shortages, thus delaying their decisions to push projects into the planning queue. If interest rates begin to tick down in the latter half of 2024, more substantive growth in nonresidential planning activity should follow.”
A flood of data center projects entered planning in April, causing robust growth in the commercial segment of the DMI, while traditional office and hotel projects continued to face slower momentum. Warehouse planning was basically flat. On the institutional side, education and healthcare planning activity receded again – in part, driven by another month of weak life science and R&D laboratory activity. Year over year, the DMI was 1% lower than in April 2023. The commercial segment was up 6% from year-ago levels, while the institutional segment was down 15% over the same period.
...
The DMI is a monthly measure of the value of nonresidential building projects going into planning, shown to lead construction spending for nonresidential buildings by a full year.
emphasis added
 Click on graph for larger image.
This graph shows the Dodge Momentum Index since 2002. The index was at 173.9 in April, up from 164.0 the previous month.
According to Dodge, this index leads "construction spending for nonresidential buildings by a full year". This index suggests a slowdown in 2024.
Commercial construction is typically a lagging economic indicator.
1st Look at Local Housing Markets in April
by Calculated Risk on 5/08/2024 11:57:00 AM
Today, in the Calculated Risk Real Estate Newsletter: 1st Look at Local Housing Markets in April
A brief excerpt:
NOTE: The tables for active listings, new listings and closed sales all include a comparison to April 2019 for each local market (some 2019 data is not available).There is much more in the article.
This is the first look at several early reporting local markets in April. I’m tracking over 40 local housing markets in the US. Some of the 40 markets are states, and some are metropolitan areas. I’ll update these tables throughout the month as additional data is released.
Closed sales in April were mostly for contracts signed in February and March when 30-year mortgage rates averaged 6.78% and 6.82%, respectively (Freddie Mac PMMS). This is down from the 7%+ mortgage rates in the August through November period (although rates are now back above 7% again)..
...
In April, sales in these markets were up 10.2% YoY. In March, these same markets were down 9.4% year-over-year Not Seasonally Adjusted (NSA).
Sales in most of these markets are down compared to January 2019. Sales in Nashville are up compared to 2019.
...
This is a year-over-year increase NSA for these early reporting markets. However, there were two more working days in April 2024 compared to April 2023, so sales Seasonally Adjusted will be lower year-over-year than Not Seasonally Adjusted sales.
...
This was just a few early reporting markets. Many more local markets to come!

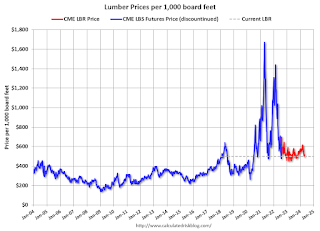
Update: Lumber Prices Mostly Unchanged YoY
by Calculated Risk on 5/08/2024 09:58:00 AM
Here is another monthly update on lumber prices.
Unfortunately, this impacts long term price comparisons since the new contract was priced about 24% higher than the old random length contract for the period when both contracts were available.
This graph shows CME random length framing futures through last August (blue), and the new physically-delivered Lumber Futures (LBR) contract starting in August 2022 (Red).
 Click on graph for larger image.
We didn't see a significant runup in prices last Spring due to the housing slowdown, and we didn't see much of a pickup in early 2024.
This graph shows CME random length framing futures through last August (blue), and the new physically-delivered Lumber Futures (LBR) contract starting in August 2022 (Red).
LBR is currently at $498.50 per 1000 board feet, mostly unchanged from a year ago.
 Click on graph for larger image.
There is somewhat of a seasonal demand for lumber, and lumber prices usually peak in April or May.
We didn't see a significant runup in prices last Spring due to the housing slowdown, and we didn't see much of a pickup in early 2024.
MBA: Mortgage Applications Increased in Weekly Survey
by Calculated Risk on 5/08/2024 07:00:00 AM
From the MBA: Mortgage Applications Increase in Latest MBA Weekly Survey
Mortgage applications increased 2.6 percent from one week earlier, according to data from the Mortgage Bankers Association’s (MBA) Weekly Mortgage Applications Survey for the week ending May 3, 2024.
The Market Composite Index, a measure of mortgage loan application volume, increased 2.6 percent on a seasonally adjusted basis from one week earlier. On an unadjusted basis, the Index increased 3 percent compared with the previous week. The Refinance Index increased 5 percent from the previous week and was 6 percent lower than the same week one year ago. The seasonally adjusted Purchase Index increased 2 percent from one week earlier. The unadjusted Purchase Index increased 2 percent compared with the previous week and was 17 percent lower than the same week one year ago.
“Treasury rates and mortgage rates fell last week on the news of a slowing job market, with wage growth at the slowest pace since 2021, and the Federal Reserve’s announced plans to ease quantitative tightening in June and to maintain its view that another rate hike is unlikely. The conventional 30-year rate dropped 11 basis points, and the FHA rate fell 17 basis points to 6.92 percent, back below 7% for the first time in three weeks,” said Mike Fratantoni, MBA’s Senior Vice President and Chief Economist. “Mortgage applications increased for the first time in three weeks, with refinances up 5 percent. Even with the increase, which included a 29 percent jump in VA refinances, refinance application volume remains about 6 percent below last year’s already low levels.”
Added Kan, “Driven by a 5 percent gain in FHA applications, purchase activity was up 2 percent. First-time homebuyers account for roughly half of purchase loans, and the government lending programs are an important source of financing for these homebuyers. The gain in FHA activity is a sign that this segment of the market is active.”
...
The average contract interest rate for 30-year fixed-rate mortgages with conforming loan balances ($766,550 or less) decreased to 7.18 percent from 7.29 percent, with points unchanged at 0.65 (including the origination fee) for 80 percent loan-to-value ratio (LTV) loans.
emphasis added
 Click on graph for larger image.
The first graph shows the MBA mortgage purchase index.
According to the MBA, purchase activity is down 17% year-over-year unadjusted.
Red is a four-week average (blue is weekly).
Purchase application activity is up slightly from the lows in late October 2023, and below the lowest levels during the housing bust.

The second graph shows the refinance index since 1990.
With higher mortgage rates, the refinance index declined sharply in 2022, and has mostly flat lined since then.
Tuesday, May 07, 2024
Wednesday: Mortgage Applications
by Calculated Risk on 5/07/2024 07:49:00 PM
 Note: Mortgage rates are from MortgageNewsDaily.com and are for top tier scenarios.
Wednesday:
• At 7:00 AM ET, The Mortgage Bankers Association (MBA) will release the results for the mortgage purchase applications index.
Asking Rents Mostly Unchanged Year-over-year
by Calculated Risk on 5/07/2024 11:58:00 AM
Today, in the Real Estate Newsletter: Asking Rents Mostly Unchanged Year-over-year
Brief excerpt:
Tracking rents is important for understanding the dynamics of the housing market. For example, the sharp increase in rents helped me deduce that there was a surge in household formation in 2021 (See from September 2021: Household Formation Drives Housing Demand). Now that household formation has slowed, and multi-family completions have increased, rents are under pressure.There is much more in the article.
From ApartmentList.com: Apartment List National Rent Report
Rents are up 0.5% month-over-month, down 0.8% year-over-year
Rent growth follows a seasonal pattern – rent increases generally take place during the spring and summer, whereas the fall and winter usually see a modest price dip. We are currently transitioning into the busy season, with the national median rent increasing for the third straight month, following six consecutive monthly declines from August 2023 to January 2024. However, the pace of that positive rent growth slowed slightly this month, with rents up 0.5 percent month-over-month in April, after increasing by 0.6 percent in March.

AAR: Rail Carloads Down YoY in April, Intermodal Up
by Calculated Risk on 5/07/2024 11:01:00 AM
From the Association of American Railroads (AAR) Rail Time Indicators. Graphs and excerpts reprinted with permission.
Total originated U.S. carloads averaged 212,221 per week in April 2024, down 6.5% from April 2023 and the second lowest weekly average for April in our records that go back to 1988. (April 2020 was lower.) Total carloads fell year over year each of the first four months of 2024. Year-to-date total carloads through April were down 4.8% and, at 3.62 million, were the lowest for any year in our records.
The main reason is coal. ...
U.S. railroads also originated 1.02 million intermodal containers and trailers in April 2024, up 8.6% over April 2023 — intermodal’s eighth straight year-over-year gain. (Intermodal is not included in carloads.)
emphasis added
 Click on graph for larger image.
This graph from the Rail Time Indicators report shows the six-week average of U.S. Carloads in 2022, 2023 and 2024:
Total originated U.S. carloads in April 2024 were 848,882, down 6.5% (58,751 carloads) from April 2023. The weekly average in April 2024 was 212,221 carloads per week, the second lowest for April in our records that go back to 1988. (April 2020, when the pandemic was just starting, was lower.) Year-to-date total carloads through April were 3.62 million, down 4.8% (180,839 carloads) from last year. Total carloads fell year-over-year each of the first four months of 2024.
It’s a broken record at this point, but blame coal. In April 2024, coal averaged 46,303 carloads per week, down 28.0% from April 2023 — the fourth straight double-digit percentage decline.
 The second graph shows the six-week average (not monthly) of U.S. intermodal in 2022, 2023 and 2024: (using intermodal or shipping containers):
U.S. railroads originated 1.02 million intermodal containers and trailers in April 2024, up 8.6% (80,471 units) over April 2023 — intermodal’s eighth straight gain. In April 2024, intermodal averaged 254,642 units per week. April’s average from 2015 to 2023 was 257,701, slightly higher than April 2024. Last year wasn’t a good year for intermodal — it was the lowest since 2013 — and the gains this year have essentially returned intermodal volume back to normal.
Wholesale Used Car Prices Declined in April; Down 14.0% Year-over-year
by Calculated Risk on 5/07/2024 09:06:00 AM
From Manheim Consulting today: Wholesale Used-Vehicle Prices Declined in April
Wholesale used-vehicle prices (on a mix, mileage, and seasonally adjusted basis) were down in April compared to March. The Manheim Used Vehicle Value Index (MUVVI) fell to 198.4, a decline of 14.0% from a year ago. The seasonal adjustment to the index magnified the results for the month, resulting in a 2.3% month-over-month decrease. The non-adjusted price in April decreased by 0.6% compared to March, moving the unadjusted average price down 11.9% year over year.
emphasis added
 Click on graph for larger image.
This index from Manheim Consulting is based on all completed sales transactions at Manheim’s U.S. auctions.
The Manheim index suggests used car prices declined in April (seasonally adjusted) and were down 14.0% year-over-year (YoY).
CoreLogic: US Home Prices Increased 5.3% Year-over-year in March
by Calculated Risk on 5/07/2024 08:00:00 AM
Notes: This CoreLogic House Price Index report is for March. The recent Case-Shiller index release was for February. The CoreLogic HPI is a three-month weighted average and is not seasonally adjusted (NSA).
From CoreLogic: Northeast Continues to Lead US for Annual Home Price Gains in March, CoreLogic Reports
• U.S. single-family home prices rose by 5.3% year over year in March, marking the 146th consecutive month of annual growth.This was a smaller YoY increase than the 5.5% reported for February, and the 5.8% YoY increase reported for January.
• Over the next 12 months, year-over-year home price gains are projected to range between 5.6% and 3.7%.
• Four of the top five states for annual appreciation in March are in the Northeast: New Jersey (12.2%), New Hampshire (10.6%), Connecticut (9.5%) and Rhode Island (9.2%).
...
U.S. year-over-year home price gains remained above 5% in March for the fifth straight month and are projected to stay in that general range for most of the next 12 months. Northeastern states continued to post the nation’s largest gains, as more Americans migrate to bedroom communities of major cities and job hubs, as well as areas where household incomes are relatively higher and can sustain the elevated cost of homeownership. In addition, the inventory gains seen in states like Florida and Texas still lag in the Northeast, a trend that continues to exacerbate supply-and-demand fundamentals and further adds to home price pressure in that region. Consequently, markets with larger additions of homes for sale are now experiencing slowing home price appreciation.
“Home prices increased again this March beyond the typical seasonal uptick, despite mortgage rates reaching this year’s high and the affordability crunch continuing to keep many prospective buyers on the sidelines,” said Dr. Selma Hepp, chief economist for CoreLogic. “Even with the long-anticipated break in for-sale inventory, the surging cost of homeownership, further fueled by rising insurance and tax expenses, is holding potential home sales back, as is evident in the slow rise in sales compared with last year. These price pressures reflect the overall supply-and-demand mismatch, as well as continued interest from households with larger budgets.”
emphasis added


