 RSS Feed
 by Calculated Risk on 5/12/2024 08:21:00 AM
Sunday, May 12, 2024
Trends in Educational Attainment in the U.S. Labor Force
The first graph shows the unemployment rate by four levels of education (all groups are 25 years and older) through April 2024. Note: This is an update to a post from a few years ago.
Unfortunately, this data only goes back to 1992 and includes only three recessions (the stock / tech bust in 2001, and the housing bust/financial crisis, and the 2020 pandemic). Clearly education matters with regards to the unemployment rate, with the lowest rate for college graduates at 2.2% in April, and highest for those without a high school degree at 6.0% in April.
All four groups were generally trending down prior to the pandemic, and all are close to pre-pandemic levels now.
 Click on graph for larger image.
Note: This says nothing about the quality of jobs - as an example, a college graduate working at minimum wage would be considered "employed".
This brings up an interesting question: What is the composition of the labor force by educational attainment, and how has that been changing over time?
Here is some data on the U.S. labor force by educational attainment since 1992.
 Currently, over 64 million people (25 and over) in the U.S. labor force have a bachelor's degree or higher. This is over 44% of the labor force, up from 26.2% in 1992.
This is the only category trending up (although flattened a little recently). "Some college", "high school" and "less than high school" have been trending down.
Based on recent trends, probably half the labor force will have at least a bachelor's degree sometime next decade (2030s).
Some thoughts: Since workers with bachelor's degrees typically have a lower unemployment rate, rising educational attainment is probably a factor in pushing down the overall unemployment rate over time.
Also, I'd guess more education would mean less labor turnover, and that education is a factor in lower weekly claims.
A more educated labor force is a positive for the future.
Saturday, May 11, 2024
Real Estate Newsletter Articles this Week: Housing Starts: Record Average Length of Time from Start to Completion in 2023
by Calculated Risk on 5/11/2024 02:11:00 PM
At the Calculated Risk Real Estate Newsletter this week:
• Housing Starts: Record Average Length of Time from Start to Completion in 2023
• Part 1: Current State of the Housing Market; Overview for mid-May 2024
• 1st Look at Local Housing Markets in April
• Asking Rents Mostly Unchanged Year-over-year
• ICE Mortgage Monitor: Annual home price growth eased in March
This is usually published 4 to 6 times a week and provides more in-depth analysis of the housing market.
Schedule for Week of May 12, 2024
by Calculated Risk on 5/11/2024 08:11:00 AM
The key reports this week are April CPI, Retail Sales and Housing Starts.
For manufacturing, April Industrial Production, and the May NY and Philly Fed manufacturing surveys will be released.
No major economic releases scheduled.
6:00 AM ET: NFIB Small Business Optimism Index for April.
8:30 AM: The Producer Price Index for April from the BLS. The consensus is for a 0.2% increase in PPI, and a 0.2% increase in core PPI.
10:00 AM: Discussion, Fed Chair Jerome H. Powell, Moderated Discussion with Chair Powell and De Nederlandsche Bank (DNB) President Klaas Knot, At the Annual General Meeting, Foreign Bankers’ Association, Amsterdam
11:00 AM: NY Fed: Q1 Quarterly Report on Household Debt and Credit
7:00 AM ET: The Mortgage Bankers Association (MBA) will release the results for the mortgage purchase applications index.
8:30 AM: The Consumer Price Index for April from the BLS. The consensus is for 0.3% increase in CPI (up 3.4% YoY), and a 0.3% increase in core CPI (up 3.6% YoY).
 8:30 AM ET: Retail sales for April is scheduled to be released. The consensus is for 0.4% increase in retail sales.
This graph shows retail sales since 1992. This is monthly retail sales and food service, seasonally adjusted (total and ex-gasoline).
8:30 AM: The New York Fed Empire State manufacturing survey for May. The consensus is for a reading of -10.8, up from -14.3.
10:00 AM: The May NAHB homebuilder survey. The consensus is for a reading of 51 unchanged from 51 last month. Any number below 50 indicates that more builders view sales conditions as poor than good.
 8:30 AM ET: Housing Starts for April.
 This graph shows single and total housing starts since 2000.
The consensus is for 1.410 million SAAR, up from 1.321 million SAAR in March.
8:30 AM: The initial weekly unemployment claims report will be released. The consensus is for 222 thousand initial claims, down from 231 thousand last week.
8:30 AM: the Philly Fed manufacturing survey for May. The consensus is for a reading of 8.0, down from 15.5.
 9:15 AM: The Fed will release Industrial Production and Capacity Utilization for April.
This graph shows industrial production since 1967.
The consensus is for a 0.2% increase in Industrial Production, and for Capacity Utilization to be unchanged at 78.4%.
10:00 AM: State Employment and Unemployment (Monthly) for April 2023
Friday, May 10, 2024
May 10th COVID Update: Weekly Deaths Continue to Decline
by Calculated Risk on 5/10/2024 07:01:00 PM
 Note: Mortgage rates are from MortgageNewsDaily.com and are for top tier scenarios.
It is likely that we will see a new pandemic low for weekly deaths next week. That is welcome news!
For deaths, I'm currently using 4 weeks ago for "now", since the most recent three weeks will be revised significantly.
Note: "Effective May 1, 2024, hospitals are no longer required to report COVID-19 hospital admissions, hospital capacity, or hospital occupancy data." So I'm no longer tracking hospitalizations, however hospitalizations were at a pandemic low two weeks ago.
| COVID Metrics | ||||
|---|---|---|---|---|
| Now | Week Ago | Goal | ||
| Deaths per Week | 512 | 582 | ≤3501 | |
| 1my goals to stop weekly posts, 🚩 Increasing number weekly for Deaths ✅ Goal met. | ||||
 Click on graph for larger image.
This graph shows the weekly (columns) number of deaths reported.
Weekly deaths have declined sharply from the recent peak of 2,561 but are still 4% above the pandemic low of 491 last July.
 This appears to be a leading indicator for COVID hospitalizations and deaths.
Nationally, COVID in wastewater is now off more than 90% from the holiday peak at the end of December - and also at the lows of last year - and that suggests weekly deaths will continue to decline.
Part 1: Current State of the Housing Market; Overview for mid-May 2024
by Calculated Risk on 5/10/2024 12:37:00 PM
Today, in the Calculated Risk Real Estate Newsletter: Part 1: Current State of the Housing Market; Overview for mid-May 2024
A brief excerpt:
This 2-part overview for mid-May provides a snapshot of the current housing market.There is much more in the article.
I always like to start with inventory, since inventory usually tells the tale!
...
Here is a graph of new listing from Realtor.com’s April 2024 Monthly Housing Market Trends Report showing new listings were 12.2% year-over-year in April. This is still well below pre-pandemic levels. From Realtor.com:
However, providing a boost to overall inventory, which has been a drag on sales the past couple of years, sellers turned out in higher numbers this April as newly listed homes were 12.2% above last year’s levels, matching last month’s growth rate. This marked the sixth month of increasing listing activity after a 17-month streak of declines.Note the seasonality for new listings. December and January are seasonally the weakest months of the year for new listings, followed by February and November. New listings will be up year-over-year in 2024, but still below normal levels.
There are always people that need to sell due to the so-called 3 D’s: Death, Divorce, and Disease. Also, in certain times, some homeowners will need to sell due to unemployment or excessive debt (neither is much of an issue right now).
And there are homeowners who want to sell for a number of reasons: upsizing (more babies), downsizing, moving for a new job, or moving to a nicer home or location (move-up buyers). It is some of the “want to sell” group that has been locked in with the golden handcuffs over the last couple of years, since it is financially difficult to move when your current mortgage rate is around 3%, and your new mortgage rate will be above 7%.
But time is a factor for this “want to sell” group, and eventually some of them will take the plunge. That is probably why we are seeing more new listings now.

Q2 GDP Tracking: 3%+
by Calculated Risk on 5/10/2024 11:30:00 AM
From Goldman:
We boosted our Q2 GDP tracking estimate by 0.1pp to +3.4% (qoq ar) and left our domestic final sales estimate unchanged at +2.7%. [May 7th estimate]And from the Altanta Fed: GDPNow
emphasis added
The GDPNow model estimate for real GDP growth (seasonally adjusted annual rate) in the second quarter of 2024 is 4.2 percent on May 8, up from 3.3 percent on May 2. After recent releases from the US Bureau of Economic Analysis, the US Census Bureau, the Institute for Supply Management, and the US Census Bureau, the nowcasts of second-quarter real personal consumption expenditures growth and second-quarter real gross private domestic investment growth increased from 3.2 percent and 4.1 percent, respectively, to 3.9 percent and 6.8 percent, while the nowcast of the contribution of the change in real net exports to second-quarter real GDP growth decreased from -0.05 percentage points to -0.10 percentage points. [May 8th estimate]
Hotels: Occupancy Rate decreased 0.8% Year-over-year
by Calculated Risk on 5/10/2024 08:21:00 AM
From STR: U.S. hotel results for week ending 4 May
U.S. hotel performance showed mixed results from the previous week, according to CoStar’s latest data through 4 May. ...The following graph shows the seasonal pattern for the hotel occupancy rate using the four-week average.
28 April through 4 May 2024 (percentage change from comparable week in 2023):
• Occupancy: 64.4% (-0.8%)
• Average daily rate (ADR): US$159.97 (+1.3%)
• Revenue per available room (RevPAR): US$103.09 (+0.5%)
emphasis added
 Click on graph for larger image.
The red line is for 2024, black is 2020, blue is the median, and dashed light blue is for 2023. Dashed purple is for 2018, the record year for hotel occupancy.
The 4-week average of the occupancy rate is tracking last year, and slightly above the median rate for the period 2000 through 2023 (Blue).
Note: Y-axis doesn't start at zero to better show the seasonal change.
The 4-week average of the occupancy rate will move mostly sideways seasonally until the summer travel season.
Thursday, May 09, 2024
"Mortgage Rates Technically at Lowest Levels in a Month"
by Calculated Risk on 5/09/2024 07:18:00 PM
 From Matthew Graham at Mortgage News Daily: Mortgage Rates Technically at Lowest Levels in a Month
The most prevalently quoted conventional 30yr fixed rates are at the lowest levels in a month as of today, but there are a few "yeah buts" ... the above has played out in a very narrow range in the bigger picture. The big spike on April 10th was in a completely different league and it was exclusively a response to the Consumer Price Index (CPI). With that in mind, the next CPI will be released next Wednesday. It has just as much power to cause just as big of a move as it did last time, for better or worse. [30 year fixed 7.18%]Tuesday:
emphasis added
• At 10:00 AM ET, University of Michigan's Consumer sentiment index (Preliminary for May).
Housing Starts: Record Average Length of Time from Start to Completion in 2023
by Calculated Risk on 5/09/2024 12:47:00 PM
Today, in the Calculated Risk Real Estate Newsletter: Housing Starts: Record Average Length of Time from Start to Completion in 2023
A brief excerpt:
In 2023, it took a record 8.6 months from start to completion for single family homes, up from an already elevated 8.3 months in 2022. For 2+ unit buildings, it took a record 17.1 months for buildings with 2 or more units in 2023, unchanged from 17.1 months in 2022.There is more in the article.
...
The delays following the housing bubble were due to many projects being mothballed for several years. The recent delays were due to pandemic related supply constraints.

Realtor.com Reports Active Inventory Up 35.1% YoY; New Listings Up 3.6% YoY
by Calculated Risk on 5/09/2024 11:30:00 AM
What this means: On a weekly basis, Realtor.com reports the year-over-year change in active inventory and new listings. On a monthly basis, they report total inventory. For April, Realtor.com reported inventory was up 30.4% YoY, but still down almost 36% compared to April 2017 to 2019 levels.
Now - on a weekly basis - inventory is up 35.1% YoY.
Realtor.com has monthly and weekly data on the existing home market. Here is their weekly report: Weekly Housing Trends View—Data for Week Ending May 4, 2024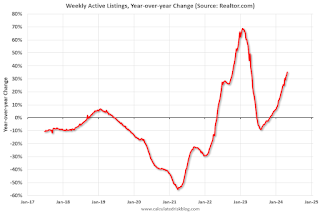 Here is a graph of the year-over-year change in inventory according to realtor.com.
Inventory was up year-over-year for the 26th consecutive week.
Realtor.com has monthly and weekly data on the existing home market. Here is their weekly report: Weekly Housing Trends View—Data for Week Ending May 4, 2024
• Active inventory increased, with for-sale homes 35.1% above year-ago levels
For the 26th straight week, there were more homes listed for sale versus the prior year, giving homebuyers more options. As mortgage rates have climbed to new 2024 highs, we could see sellers adjust their plans, since nearly three-quarters of potential sellers also plan to buy a home. However, the long buildup to listing—80% have been thinking about selling for 1 to 3 years—could mean that this year’s sellers are less deterred by market fluctuations.
• New listings—a measure of sellers putting homes up for sale—were up this week, by 3.6% from one year ago
Although the number of new listings kept rising, the rate of increase slowed considerably compared with the double-digit surges seen in recent weeks. This slowdown highlighted the extent to which sellers’ sentiments are influenced by mortgage rates.
As mortgage rates breach 7% once more, numerous home sellers might be inclined to postpone their selling endeavors. Should mortgage rates persist in their ascent, they will continue to suppress listing activities.
 Here is a graph of the year-over-year change in inventory according to realtor.com.
 Inventory was up year-over-year for the 26th consecutive week.
However, inventory is still historically very low.
New listings remain below typical pre-pandemic levels although up year-over-year.


