 RSS Feed
 by Calculated Risk on 5/17/2024 01:12:00 PM
Friday, May 17, 2024
Hotels: Occupancy Rate Increased 2.1% Year-over-year
The U.S. hotel industry reported higher performance from the previous week and positive comparisons year over year, according to CoStar’s latest data through 11 May. ...The following graph shows the seasonal pattern for the hotel occupancy rate using the four-week average.
5-11 May 2024 (percentage change from comparable week in 2023):
• Occupancy: 66.1% (+2.1%)
• Average daily rate (ADR): US$162.14 (+4.4%)
• Revenue per available room (RevPAR): US$107.24 (+6.6%)
emphasis added
 Click on graph for larger image.
The red line is for 2024, black is 2020, blue is the median, and dashed light blue is for 2023. Dashed purple is for 2018, the record year for hotel occupancy.
The 4-week average of the occupancy rate is tracking last year, and slightly above the median rate for the period 2000 through 2023 (Blue).
Note: Y-axis doesn't start at zero to better show the seasonal change.
The 4-week average of the occupancy rate will move mostly sideways seasonally until the summer travel season.
Lawler: Early Read on Existing Home Sales in April & 3rd Look at Local Housing Markets
by Calculated Risk on 5/17/2024 09:43:00 AM
Today, in the Calculated Risk Real Estate Newsletter: Lawler: Early Read on Existing Home Sales in April & 3rd Look at Local Housing Markets
A brief excerpt:
From housing economist Tom Lawler:There is much more in the article.
Based on publicly-available local realtor/MLS reports released across the country through today, I project that existing home sales as estimated by the National Association of Realtors ran at a seasonally adjusted annual rate of 4.23 million in April, up 1.0% from March’s preliminary pace and up 0.2% from last April’s seasonally adjusted pace. Unadjusted sales should show a significantly larger YOY % increase, as there were two more business days this April compared to last April.
Local realtor/MLS reports suggest that the median existing single-family home sales price last month was up by about 6% from last April.
CR Note: The NAR is scheduled to release April existing home sales on Wednesday, May 22nd. The consensus is for 4.18 million SAAR, down from 4.19 million in March.
...
This is a year-over-year increase NSA for these markets. However, there were two more working days in April 2024 compared to April 2023, so sales Seasonally Adjusted will be lower year-over-year than Not Seasonally Adjusted sales.
If sales increased YoY in April, this will be the first YoY increase since August 2021, following 31 consecutive months with a YoY decline in sales.

Early Q2 GDP Tracking: 1.9% to 3.6%
by Calculated Risk on 5/17/2024 08:23:00 AM
From BofA:
2Q US GDP tracking is down a tenth from our official forecast of 2.0% q/q saar to 1.9% q/q saar [May 17th estimate]From Goldman:
emphasis added
We raised our Q2 GDP tracking estimate by 0.2pp to +3.2% (qoq ar) and our domestic final sales estimate by 0.1pp to +2.5%, but we lowered our past-quarter GDP tracking estimate for Q1 by 0.1pp to +1.2% (vs. +1.6% originally reported). [May 16th estimate]And from the Altanta Fed: GDPNow
The GDPNow model estimate for real GDP growth (seasonally adjusted annual rate) in the second quarter of 2024 is 3.6 percent on May 16, down from 3.8 percent on May 15. [May 16th estimate]
Thursday, May 16, 2024
Realtor.com Reports Active Inventory Up 35.0% YoY; Most Home For Sale Since August 2020
by Calculated Risk on 5/16/2024 05:07:00 PM
What this means: On a weekly basis, Realtor.com reports the year-over-year change in active inventory and new listings. On a monthly basis, they report total inventory. For April, Realtor.com reported inventory was up 30.4% YoY, but still down almost 36% compared to April 2017 to 2019 levels.
Now - on a weekly basis - inventory is up 35.0% YoY.
Realtor.com has monthly and weekly data on the existing home market. Here is their weekly report: Weekly Housing Trends View—Data for Week Ending May 11, 2024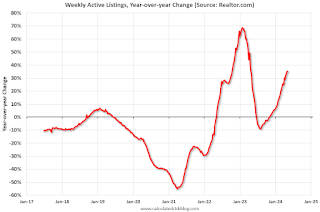 Here is a graph of the year-over-year change in inventory according to realtor.com.
Inventory was up year-over-year for the 27th consecutive week.
Realtor.com has monthly and weekly data on the existing home market. Here is their weekly report: Weekly Housing Trends View—Data for Week Ending May 11, 2024
• Active inventory increased, with for-sale homes 35.0% above year-ago levels.
For the 27th straight week, there were more homes listed for sale versus the prior year, giving homebuyers more options. In fact, last week saw the highest number of homes for sale since August 2020, a significant milestone. Though new listing activity has softened, the recent strength in listing activity means buyers are seeing more homes for sale than they have in almost 4 years. Though buyers are seeing more options at a national level, inventory abundance varies geographically. The South leads the way in inventory growth, with a 43.0% increase in inventory annually in April, while the Northeast saw inventory increase just 4.0%.
• New listings–a measure of sellers putting homes up for sale–were up this week, by 6.6% from one year ago.
Seller activity continued to climb annually last week and accelerated relative to the previous week’s growth. However, the annual increase in new listings was lower than almost every week back to early February, signifying a slowdown in new listings growth. .
 Here is a graph of the year-over-year change in inventory according to realtor.com.
 Inventory was up year-over-year for the 27th consecutive week.
However, inventory is still historically very low.
New listings remain below typical pre-pandemic levels although up year-over-year.
MBA: Mortgage Delinquencies Increased Slightly in Q1 2024
by Calculated Risk on 5/16/2024 12:01:00 PM
Today, in the Calculated Risk Real Estate Newsletter: MBA: Mortgage Delinquencies Increased Slightly in Q1 2024
A brief excerpt:
From the MBA: Mortgage Delinquencies Increase Slightly in the First Quarter of 2024There is much more in the article.The delinquency rate for mortgage loans on one-to-four-unit residential properties increased to a seasonally adjusted rate of 3.94 percent of all loans outstanding at the end of the first quarter of 2024, according to the Mortgage Bankers Association’s (MBA) National Delinquency Survey.The following graph shows the percent of loans delinquent by days past due. Overall delinquencies increased slightly in Q1. The sharp increase in 2020 in the 90-day bucket was due to loans in forbearance (included as delinquent, but not reported to the credit bureaus).
The percent of loans in the foreclosure process decreased year-over-year from 0.57 percent in Q1 2023 to 0.46 percent in Q1 2024 (red), even with the end of the foreclosure moratoriums, and remains historically low.
...
The primary concern is the increase in 30- and 60-day delinquency rates, and even though the rate is historically low, it has increased from 2.32% in Q1 2023 to 2.92% in Q1 2024. I don’t think this increase is much of a worry, but it is something to watch.

Single Family Starts Up 18% Year-over-year in March; Multi-Family Starts Down Sharply YoY
by Calculated Risk on 5/16/2024 09:35:00 AM
Today, in the Calculated Risk Real Estate Newsletter: Single Family Starts Up 18% Year-over-year in March; Multi-Family Starts Down Sharply YoY
A brief excerpt:
Total housing starts in April were above expectations, however, starts in February and March were revised down.
The third graph shows the month-to-month comparison for total starts between 2023 (blue) and 2024 (red).
Total starts were down 0.6% in April compared to April 2023.
The YoY decline was due to the sharp YoY decrease in multi-family starts.

Industrial Production Unchanged in April
by Calculated Risk on 5/16/2024 09:15:00 AM
From the Fed: Industrial Production and Capacity Utilization
Industrial production was little changed in April. Manufacturing output decreased 0.3 percent; excluding motor vehicles and parts, manufacturing output edged down 0.1 percent. The index for mining fell 0.6 percent, and the index for utilities rose 2.8 percent. At 102.8 percent of its 2017 average, total industrial production in April was 0.4 percentage point lower than its year-earlier level. Capacity utilization moved down to 78.4 percent in April, a rate that is 1.2 percentage points below its long-run (1972–2023) average.
emphasis added
 Click on graph for larger image.
This graph shows Capacity Utilization. This series is up from the record low set in April 2020, and above the level in February 2020 (pre-pandemic).
Capacity utilization at 78.4% is 1.2% below the average from 1972 to 2022. This was at consensus expectations.
Note: y-axis doesn't start at zero to better show the change.
 The second graph shows industrial production since 1967.
Industrial production was unchanged at 102.8. This is above the pre-pandemic level.
Industrial production was below consensus expectations.
Housing Starts Increased to 1.360 million Annual Rate in April
by Calculated Risk on 5/16/2024 08:32:00 AM
From the Census Bureau: Permits, Starts and Completions
Housing Starts:
Privately‐owned housing starts in April were at a seasonally adjusted annual rate of 1,360,000. This is 5.7 percent above the revised March estimate of 1,287,000, but is 0.6 percent below the April 2023 rate of 1,368,000. Single‐family housing starts in April were at a rate of 1,031,000; this is 0.4 percent below the revised March figure of 1,035,000. The April rate for units in buildings with five units or more was 322,000.
Building Permits:
Privately‐owned housing units authorized by building permits in April were at a seasonally adjusted annual rate of 1,440,000. This is 3.0 percent below the revised March rate of 1,485,000 and is 2.0 percent below the April 2023 rate of 1,470,000. Single‐family authorizations in April were at a rate of 976,000; this is 0.8 percent below the revised March figure of 984,000. Authorizations of units in buildings with five units or more were at a rate of 408,000 in April.
emphasis added
 Click on graph for larger image.
The first graph shows single and multi-family housing starts since 2000.
Multi-family starts (blue, 2+ units) increased in April compared to March. Multi-family starts were down 33.1% year-over-year.
Single-family starts (red) decreased slightly in April and were up 17.7% year-over-year.
 The second graph shows single and multi-family housing starts since 1968.
 This shows the huge collapse following the housing bubble, and then the eventual recovery - and the recent collapse and recovery in single-family starts.
Total housing starts in April were above expectations, however, starts in February and March were revised down.
I'll have more later …
Weekly Initial Unemployment Claims Decrease to 222,000
by Calculated Risk on 5/16/2024 08:30:00 AM
The DOL reported:
In the week ending May 11, the advance figure for seasonally adjusted initial claims was 222,000, a decrease of 10,000 from the previous week's revised level. The previous week's level was revised up by 1,000 from 231,000 to 232,000. The 4-week moving average was 217,750, an increase of 2,500 from the previous week's revised average. The previous week's average was revised up by 250 from 215,000 to 215,250.The following graph shows the 4-week moving average of weekly claims since 1971.
emphasis added
 Click on graph for larger image.
The dashed line on the graph is the current 4-week average. The four-week average of weekly unemployment claims increased to 217,750.
The previous week was revised up.
Weekly claims were at the consensus forecast.
Wednesday, May 15, 2024
Thursday: Housing Starts, Unemployment Claims, Industrial Production, Philly Fed Mfg
by Calculated Risk on 5/15/2024 07:01:00 PM
 Note: Mortgage rates are from MortgageNewsDaily.com and are for top tier scenarios.
Thursday:
• At 8:30 AM ET, Housing Starts for April. The consensus is for 1.410 million SAAR, up from 1.321 million SAAR in March.
• Also at 8:30 AM, The initial weekly unemployment claims report will be released. The consensus is for 222 thousand initial claims, down from 231 thousand last week.
• Also at 8:30 AM, the Philly Fed manufacturing survey for May. The consensus is for a reading of 8.0, down from 15.5.
• At 9:15 AM, The Fed will release Industrial Production and Capacity Utilization for April. The consensus is for a 0.2% increase in Industrial Production, and for Capacity Utilization to be unchanged at 78.4%.


