 RSS Feed
 by Calculated Risk on 6/02/2024 08:21:00 AM
Sunday, June 02, 2024
Hotels: Occupancy Rate Increased 1.6% Year-over-year
The U.S. hotel industry reported mixed performance results from the previous week but positive comparisons year over year, according to CoStar’s latest data through 25 May. ...The following graph shows the seasonal pattern for the hotel occupancy rate using the four-week average.
19-25 May 2024 (percentage change from comparable week in 2023):
• Occupancy: 67.7% (+1.6%)
• Average daily rate (ADR): US$160.67 (+2.3%)
• Revenue per available room (RevPAR): US$108.73 (+3.9%)
emphasis added
 Click on graph for larger image.
The red line is for 2024, blue is the median, and dashed light blue is for 2023. Dashed purple is for 2018, the record year for hotel occupancy.
The 4-week average of the occupancy rate is tracking last year, and slightly above the median rate for the period 2000 through 2023 (Blue).
Note: Y-axis doesn't start at zero to better show the seasonal change.
The 4-week average of the occupancy rate will increase seasonally when the summer travel season begins.
Saturday, June 01, 2024
Real Estate Newsletter Articles this Week: House Price Index Up 6.5% year-over-year in March
by Calculated Risk on 6/01/2024 02:11:00 PM
At the Calculated Risk Real Estate Newsletter this week:
 Click on graph for larger image.
• Case-Shiller: National House Price Index Up 6.5% year-over-year in March
• Inflation Adjusted House Prices 2.2% Below Peak
• Fannie and Freddie: Single Family Serious Delinquency Rate Decreased in April, Multi-family Increased Slightly
• Final Look at Local Housing Markets in April and a Look Ahead to May Sales
This is usually published 4 to 6 times a week and provides more in-depth analysis of the housing market.
Schedule for Week of June 2, 2024
by Calculated Risk on 6/01/2024 08:11:00 AM
The key report scheduled for this week is the May employment report.
Other key reports include the May ISM Manufacturing, Vehicle Sales and April trade balance.
10:00 AM: ISM Manufacturing Index for May. The consensus is for the ISM to be at 49.7, up from 49.2 in April.
10:00 AM: Construction Spending for April. The consensus is for a 0.2% increase in construction spending.
 Late: Light vehicle sales for May.
The consensus is for light vehicle sales to be 15.9 million SAAR in May, up from 15.7 million in April (Seasonally Adjusted Annual Rate).
This graph shows light vehicle sales since the BEA started keeping data in 1967. The dashed line is the sales rate for last month.
----- Tuesday, June 4th -----
 10:00 AM ET: Job Openings and Labor Turnover Survey for April from the BLS.
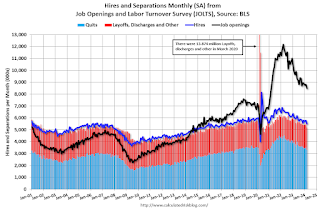
This graph shows job openings (black line), hires (purple), Layoff, Discharges and other (red column), and Quits (light blue column) from the JOLTS.
Jobs openings decreased in March to 8.49 million from 8.81 million in February. The number of job openings (black) were down 12% year-over-year.
----- Wednesday, June 5th -----
7:00 AM ET: The Mortgage Bankers Association (MBA) will release the results for the mortgage purchase applications index.
8:15 AM: The ADP Employment Report for May. This report is for private payrolls only (no government). The consensus is for 174,000 payroll jobs added in May, down from 192,000 in April.
10:00 AM: the ISM Services Index for May. The consensus is for a reading of 50.5, up from 59.4.
----- Thursday, June 6th -----
 8:30 AM: Trade Balance report for April from the Census Bureau.
This graph shows the U.S. trade deficit, with and without petroleum.
 10:00 AM ET: Job Openings and Labor Turnover Survey for April from the BLS.
 This graph shows job openings (black line), hires (purple), Layoff, Discharges and other (red column), and Quits (light blue column) from the JOLTS.
Jobs openings decreased in March to 8.49 million from 8.81 million in February. The number of job openings (black) were down 12% year-over-year.
7:00 AM ET: The Mortgage Bankers Association (MBA) will release the results for the mortgage purchase applications index.
8:15 AM: The ADP Employment Report for May. This report is for private payrolls only (no government). The consensus is for 174,000 payroll jobs added in May, down from 192,000 in April.
10:00 AM: the ISM Services Index for May. The consensus is for a reading of 50.5, up from 59.4.
 8:30 AM: Trade Balance report for April from the Census Bureau.
 This graph shows the U.S. trade deficit, with and without petroleum.
The blue line is the total deficit, and the black line is the petroleum surplus, and the red line is the trade deficit ex-petroleum products.
The consensus is the trade deficit to be $69.7 billion. The U.S. trade deficit was at $69.4 Billion in March.
8:30 AM: The initial weekly unemployment claims report will be released. The consensus is for 215 thousand initial claims, down from 219 thousand last week.
----- Friday, June 7th -----
 8:30 AM: Employment Report for May. The consensus is for 180,000 jobs added, and for the unemployment rate to be unchanged at 3.9%.
There were 175,000 jobs added in April, and the unemployment rate was at 3.9%.
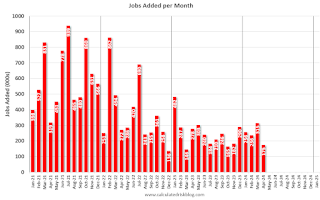
This graph shows the jobs added per month since January 2021.
The consensus is the trade deficit to be $69.7 billion. The U.S. trade deficit was at $69.4 Billion in March.
8:30 AM: The initial weekly unemployment claims report will be released. The consensus is for 215 thousand initial claims, down from 219 thousand last week.
 8:30 AM: Employment Report for May. The consensus is for 180,000 jobs added, and for the unemployment rate to be unchanged at 3.9%.
There were 175,000 jobs added in April, and the unemployment rate was at 3.9%.
This graph shows the jobs added per month since January 2021.
Friday, May 31, 2024
May 31st COVID Update: Weekly Deaths at New Pandemic Low!
by Calculated Risk on 5/31/2024 07:10:00 PM
 Note: Mortgage rates are from MortgageNewsDaily.com and are for top tier scenarios.
For deaths, I'm currently using 4 weeks ago for "now", since the most recent three weeks will be revised significantly.
Note: "Effective May 1, 2024, hospitals are no longer required to report COVID-19 hospital admissions, hospital capacity, or hospital occupancy data." So I'm no longer tracking hospitalizations, however hospitalizations were at a pandemic low three weeks ago.
| COVID Metrics | ||||
|---|---|---|---|---|
| Now | Week Ago | Goal | ||
| Deaths per Week | 378 | 391 | ≤3501 | |
| 1my goals to stop weekly posts, 🚩 Increasing number weekly for Deaths ✅ Goal met. | ||||
 Click on graph for larger image.
This graph shows the weekly (columns) number of deaths reported.
Weekly deaths have declined from the recent peak of 2,561 and are now below the previous pandemic low of 491 last July.
 This appears to be a leading indicator for COVID hospitalizations and deaths.
Nationally, COVID in wastewater is now off about 90% from the holiday peak at the end of December - and also near the lows of last year - and that suggests weekly deaths will continue to decline. However, there was a pickup recently, especially in the West.
Q2 GDP Tracking: 1.8% to 2.8%
by Calculated Risk on 5/31/2024 01:01:00 PM
From BofA:
1Q GDP was revised down by three-tenths to 1.3% q/q saar, which was broadly in line with our expectations. Meanwhile, our estimate of 2Q GDP ended up unchanged at 1.8% q/q saar from a week ago. [May 31st estimate]From Goldman:
emphasis added
The consumption details in this morning’s report indicate weak spending momentum to start the quarter, and we lowered our Q2 GDP tracking estimate by 0.4pp to +2.8% (qoq ar) and our domestic final sales estimate by the same amount to +2.1%. [May 31st estimate]And from the Altanta Fed: GDPNow
The GDPNow model estimate for real GDP growth (seasonally adjusted annual rate) in the second quarter of 2024 is 2.7 percent on May 31, down from 3.5 percent on May 24. After recent releases from the US Census Bureau and the US Bureau of Economic Analysis, a decrease in the nowcast of second-quarter real personal consumption expenditures growth from 3.4 percent to 2.6 percent was partly offset by an increase in the nowcast of second-quarter real gross private domestic investment growth from 5.1 percent to 6.3 percent, while the nowcast of the contribution of the change in real net exports to second-quarter real GDP growth decreased from -0.06 percentage points to -0.60 percentage points. [May 31st estimate]
Fannie and Freddie: Single Family Serious Delinquency Rate Decreased in April, Multi-family Increased Slightly
by Calculated Risk on 5/31/2024 09:48:00 AM
Today, in the Calculated Risk Real Estate Newsletter: Fannie and Freddie: Single Family Serious Delinquency Rate Decreased in April, Multi-family Increased Slightly
Brief excerpt:
Single-family serious delinquencies decreased in April, and multi-family serious delinquencies increased slightly.
...
Freddie Mac reports that the multi-family delinquencies rate increased to 0.35% in April, up from 0.34% in March, and down from 0.44% in January.
This graph shows the Freddie multi-family serious delinquency rate since 2012. Rates were still high in 2012 following the housing bust and financial crisis.
The multi-family rate increased following the pandemic and has increased recently as rent growth has slowed, vacancy rates have increased, and borrowing rates have increased sharply. The rate surged higher in January but declined in February and March. This will be something to watch as more apartments come on the market.

There is much more in the article.
PCE Measure of Shelter Slows to 5.6% YoY in April
by Calculated Risk on 5/31/2024 08:57:00 AM
Here is a graph of the year-over-year change in shelter from the CPI report and housing from the PCE report this morning, both through April 2024.
 CPI Shelter was up 5.5% year-over-year in April, down from 5.6% in March, and down from the cycle peak of 8.2% in March 2023.
Housing (PCE) was up 5.6% YoY in April, down from 5.8% in March, and down from the cycle peak of 8.3% in April 2023.
Since asking rents are mostly flat year-over-year, these measures will continue to slow over the next year.
Since asking rents are mostly flat year-over-year, these measures will continue to slow over the next year.
 The second graph shows PCE prices, Core PCE prices and Core ex-housing over the last 6 months (annualized):
Key measures are above the Fed's target on a 6-month basis. Note: There appears to be some residual seasonality distorting PCE, especially in January.
Personal Income increased 0.3% in April; Spending increased 0.2%
by Calculated Risk on 5/31/2024 08:30:00 AM
The BEA released the Personal Income and Outlays report for April:
Personal income increased $65.3 billion (0.3 percent at a monthly rate) in April, according to estimates released today by the Bureau of Economic Analysis. Disposable personal income (DPI) —personal income less personal current taxes—increased $40.2 billion and personal consumption expenditures (PCE) increased $39.1 billion.The April PCE price index increased 2.7 percent year-over-year (YoY), unchanged from 2.7 percent YoY in March, and down from the recent peak of 7.0 percent in June 2022.
The PCE price index increased 0.3 percent. Excluding food and energy, the PCE price index increased 0.2 percent. Real DPI decreased 0.1 percent in April and real PCE decreased 0.1 percent; goods decreased 0.4 percent and services increased 0.1 percent.
emphasis added
The PCE price index, excluding food and energy, increased 2.8 percent YoY, unchanged from 2.8 percent in March, and down from the recent peak of 5.4 percent in February 2022.
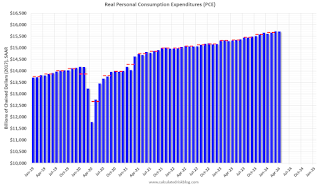
The following graph shows real Personal Consumption Expenditures (PCE) through April 2024 (2017 dollars). Note that the y-axis doesn't start at zero to better show the change.
 Click on graph for larger image.
The dashed red lines are the quarterly levels for real PCE.
Personal income was at expectations, and PCE was below expectations.
Inflation was at expectations.
Thursday, May 30, 2024
Friday: Personal Income and Outlays
by Calculated Risk on 5/30/2024 08:09:00 PM
 Note: Mortgage rates are from MortgageNewsDaily.com and are for top tier scenarios.
Friday:
• At 8:30 AM ET, Personal Income and Outlays, April 2024. The consensus is for a 0.3% increase in personal income, and for a 0.3% increase in personal spending. And for the Core PCE price index to increase 0.3%. PCE prices are expected to be up 2.7% YoY, and core PCE prices up 2.8% YoY.
• At 9:45 AM, Chicago Purchasing Managers Index for May.
Realtor.com Reports Active Inventory Up 36.5% YoY; Most Homes For Sale Since July 2020
by Calculated Risk on 5/30/2024 02:35:00 PM
What this means: On a weekly basis, Realtor.com reports the year-over-year change in active inventory and new listings. On a monthly basis, they report total inventory. For April, Realtor.com reported inventory was up 30.4% YoY, but still down almost 36% compared to April 2017 to 2019 levels.
Now - on a weekly basis - inventory is up 36.5% YoY.
Realtor.com has monthly and weekly data on the existing home market. Here is their weekly report: Weekly Housing Trends View—Data for Week Ending May 25, 2024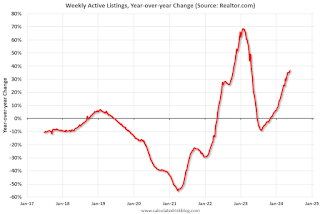 Here is a graph of the year-over-year change in inventory according to realtor.com.
Inventory was up year-over-year for the 29th consecutive week.
Realtor.com has monthly and weekly data on the existing home market. Here is their weekly report: Weekly Housing Trends View—Data for Week Ending May 25, 2024
• Active inventory increased, with for-sale homes 36.5% above year-ago levels.
For the 29th straight week, there were more homes listed for sale versus the prior year, giving homebuyers more options. This past week, the inventory of homes for sale grew by 36.5% compared with last year, and it was the highest since July 2020 in the early days of the COVID-19 Pandemic. This growth in inventory is primarily driven by housing markets in the South, which saw a 43.0% year-over-year increase in inventory in April.
• New listings–a measure of sellers putting homes up for sale–were up this week, by 3.6% from one year ago.
Seller activity continued to climb annually last week but decelerated relative to the previous week’s growth. Newly listed homes grew by 3.6% compared with a year ago, a slowdown from the 8.1% growth rate in the previous week.
 Here is a graph of the year-over-year change in inventory according to realtor.com.
 Inventory was up year-over-year for the 29th consecutive week.
However, inventory is still historically very low.
New listings remain below typical pre-pandemic levels although up year-over-year.


