Chromostereopsis

The effect varies for different people. Take a moment and look at this. Some people don’t see anything special: just a blue iris in a red eye.

Image: CC-BY Tom Stafford 2022

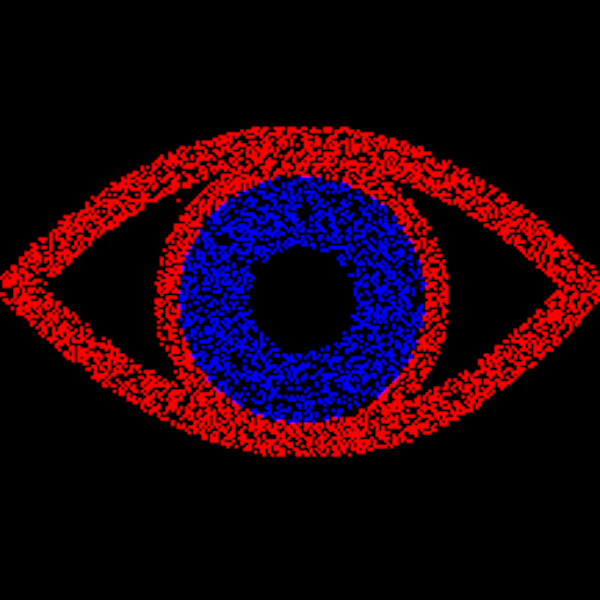
For me though, there is an incredibly strong depth illusion – the blue and the red appear as if they are at different distances.

I can enhance the effect by blinking rapidly, turning the brightness up on my screen and viewing in a dark room. Sometimes it disappears for a few seconds before snapping back in. Because the colours appear at different depths they even appear to glide separately when I move my head from side to side, something which is obviously impossible for a static image.

The effect is called chromostereopsis and it is weirding me out, for several reasons.

The first is that I’d thought I’d seen all the illusions, and this one is completely new to me. Like, guys, did you all know and weren’t telling?

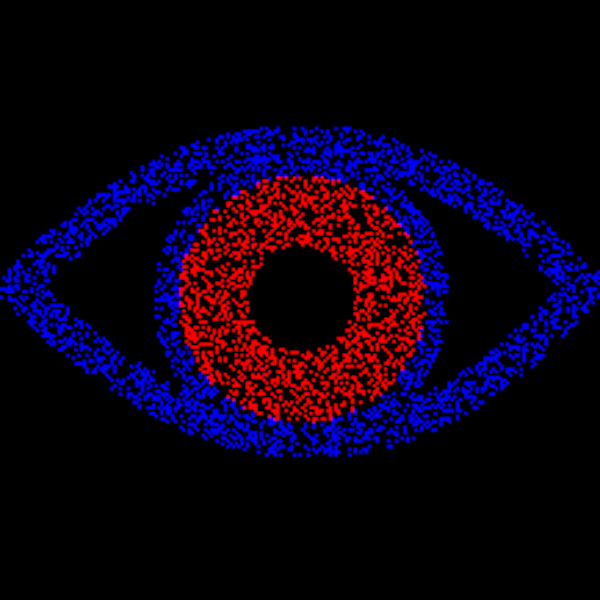
The second is that there are big individual differences in perception of the effect. This isn’t just in terms of strength, although obviously I’m one of those it hits hard. People also differ in which colour looks closer. For most people it is red, with blue looking deeper or further away. I’m in the minority, so if you’re like me this reverse of the image above should look more natural: the iris set deeper than the surrounding eye.

Image: CC-BY Tom Stafford 2022

The third reason this effect is weird to me is that stereo-depth illusions usually require two images, separately presented to each eye. This is how 3D cinema works – you wear red-green or polarising classes and the 3D parts of the film present two superimposed images, each image filtered out by only one lens, putting slightly different images in each eye. Your visual system combines the image and ‘discovers’ depth information, adding to the 3D perception of the objects shown. The superimposed images are why the film looks funny if you take the glasses off.

Anaglyph 3-D photo of Edward Kemeys’s lion statue outside the Art Institute of Chicago, in Illinois. Kim Scarborough CC BY-SA 3.0 us

Chromostereopic illusions are true stereo illusions – they require the information to be combined across both eyes. There are many depth illusions which aren’t stereo illusions, but this isn’t one of them. You can prove this to yourself by making the effect disappear by closing one eye. The image stays the same, but it has to go in both eyes for the illusion of depth to occur. You can also try and find someone who is “stereoblind” and show them the illusion. A small percentage of the population don’t combine information across both eyes, and so only perceive depth via the other, monocular, cues. Our visual system is so adept at doing this that many people live their whole lives without realising they are stereoblind (although I suspect they tend not to go into professions which require exact depth perception, like juggling).

The way chromostereopsis works is not entirely understood. Even the great Michael Bach, who wrote for the Mind Hacks book, describes the explanation for the phenomenon as ‘multi-varied and intricate‘. That red and blue are at opposite ends of the light spectrum has something to do with it, and the consequent fact that different wavelengths of light will be focussed differently on the back of the eyes. This may also be why some people report that their glasses intensify the effect. The luminance of the image and the background also seems to be important.

The use of colour has a long history in art, from stained glass windows to video games, and probably many visual artists have discovered chromostereopsis by instinct. One of my favourite real-world uses is the set of the panel show Have I Got News For You:

Image: Have I Got News For You, BBC. h/t @singletrackmark for pointing this out

For more on Depth Illusions, see the Mind Hacks book, chapters 20,22,24 and 31. For how I made the images, see the colophon on my personal blog.

More on the science: Kitaoka, A. (2016). Chromostereopsis. in Ming Ronnier Luo (Ed.), Encyclopedia of Color Science and Technology, Vol.1, New York; Springer (pp. 114-125).

Corrected 2022-05-18 The coloured part of the eye is the iris, not – as I originally wrote – the pupil (which is the black centre part)

Pandemonium’s friendly demons

Oliver Selfridge was an early pioneer of artificial intelligence, and in 1959 wrote a classic paper outlining a system by which simple units, each carrying out a specialised function, could be connected together to perform complex, cognitive tasks.

This ‘pandemonium architecture‘ inspired research in neural networks, which in turn led to modern machine learning about which we hear so much these days.

The Pandemonium model is best known through some fantastically characteristic illustrations by Leanne Hinton in Lindsey & Norman’s 1977 introductory psychology textbook ‘Human Information Processing’. Here’s one:

One internet citizen described the illustrations as ‘an attempt to explain the complexities of Parallel Distributed Processing through the language of a child’s nightmare.‘, but I feel more affection for them – the demons look friendly to me.

Selfridge wrote four children’s books (I don’t know who illustrated them), had three wives and helped break the story of National Security Agency spying as part of the Echelon programme.

Although the Pandemonium model is widely known, and often associated with these illustrations, the name of the illustrator, Leanne Hinton, is often omitted.

I tried to track her down to hear her side of the story, and although I identified Leanne Hinton, Professor Emerita of Linguistics, as the likely illustrator, she didn’t reply to my email so I couldn’t confirm this was her, nor get permission to publish the cartoons on this blog.

[if you know more, or want me to correct anything in this post, please get in touch]

One more image:

Do we suffer ‘behavioural fatigue’ for pandemic prevention measures?

The Guardian recently published an article saying “People won’t get ‘tired’ of social distancing – and it’s unscientific to suggest otherwise”. “Behavioural fatigue” the piece said, “has no basis in science”.

‘Behavioural fatigue’ became a hot topic because it was part of the UK Government’s justification for delaying the introduction of stricter public health measures. They quickly reversed this position and we’re now in the “empty streets” stage of infection control.

But it’s an important topic and is relevant to all of us as we try to maintain important behavioural changes that benefit others.

For me, one key point is that, actually, there are many relevant scientific studies that tackle this. And I have to say, I’m a little disappointed that there were some public pronouncements that ‘there is no evidence’ in the mainstream media without anyone making the effort to seek it out.

The reaction to epidemics has actually been quite well studied although it’s not clear that ‘fatigue’ is the right way of understanding any potential decline in people’s compliance. This phrase doesn’t seem to be used in the medical literature in this context and it may well have been simply a convenient, albeit confusing, metaphor for ‘decline’ used in interviews.

In fact, most studies of changes in compliance focus on the effect of changing risk perception, and it turns out that this often poorly tracks the actual risk. Below is a graph from a recent paper illustrating a widely used model of how risk perception tracks epidemics.

Notably, this model was first published in the 1990s based on data available even then. It suggests that increases in risk tend to make us over-estimate the danger, particularly for surprising events, but then as the risk objectively increases we start to get used to living in the ‘new normal’ and our perception of risk decreases, sometimes unhelpfully so.

What this doesn’t tell us is whether people’s behaviour changes over time. However, lots of studies have been done since then, including on the 2009 H1N1 flu pandemic – where a lot of this research was conducted.

To cut a long story short, many, but not all, of these studies find that people tend to reduce their use of at least some preventative measures (like hand washing, social distancing) as the epidemic increases, and this has been looked at in various ways.

When asking people to report their own behaviours, several studies found evidence for a reduction in at least some preventative measures (usually alongside evidence for good compliance with others).

This was found was found in one study in Italy, two studies in Hong Kong, and one study in Malaysia.

In Holland during the 2006 bird flu outbreak, one study did seven follow-ups and found a fluctuating pattern of compliance with prevention measures. People ramped up their prevention efforts, then their was a dip, then they increased again.

Some studies have looked for objective evidence of behaviour change and one of the most interesting looked at changes in social distancing during the 2009 outbreak in Mexico by measuring television viewing as a proxy for time spent in the home. This study found that, consistent with an increase in social distancing at the beginning of the outbreak, television viewing greatly increased, but as time went on, and the outbreak grew, television viewing dropped. To try and double-check their conclusions, they showed that television viewing predicted infection rates.

One study looked at airline passengers’ missed flights during the 2009 outbreak – given that flying with a bunch of people in an enclosed space is likely to spread flu. There was a massive spike of missed flights at the beginning of the pandemic but this quickly dropped off as the infection rate climbed, although later, missed flights did begin to track infection rates more closely.

There are also some relevant qualitative studies. These are where people are free-form interviewed and the themes of what they say are reported. These studies reported that people resist some behavioural measures during outbreaks as they increasingly start to conflict with family demands, economic pressures, and so on.

Rather than measuring people’s compliance with health behaviours, several studies looked at how epidemics change and used mathematical models to test out ideas about what could account for their course.

One well recognised finding is that epidemics often come in waves. A surge, a quieter period, a surge, a quieter period, and so on.

Several mathematical modelling studies have suggested that people’s declining compliance with preventative measures could account for this. This has been found with simulated epidemics but also when looking at real data, such as that from the 1918 flu pandemic. The 1918 epidemic was an interesting example because there was no vaccine and so behavioural changes were pretty much the only preventative measure.

And some studies showed no evidence of ‘behavioural fatigue’ at all.

One study in the Netherlands showed a stable increase in people taking preventative measures with no evidence of decline at any point.

Another study conducted in Beijing found that people tended to maintain compliance with low effort measures (ventilating rooms, catching coughs and sneezes, washing hands) and tended to increase the level of high effort measures (stockpiling, buying face masks).

This improved compliance was also seen in a study that looked at an outbreak of the mosquito-borne disease chikungunya.

This is not meant to be a complete review of these studies (do add any others below) but I’m presenting them here to show that actually, there is lots of relevant evidence about ‘behavioural fatigue’ despite the fact that mainstream articles can get published by people declaring it ‘has no basis in science’.

In fact, this topic is almost a sub-field in some disciplines. Epidemiologists have been trying to incorporate behavioural dynamics into their models. Economists have been trying to model the ‘prevalence elasticity’ of preventative behaviours as epidemics progress. Game theorists have been creating models of behaviour change in terms of individuals’ strategic decision-making.

The lessons here are two fold I think.

The first is for scientists to be cautious when taking public positions. This is particularly important in times of crisis. Most scientific fields are complex and can be opaque even to other scientists in closely related fields. Your voice has influence so please consider (and indeed research) what you say.

The second is for all of us. We are currently in the middle of a pandemic and we have been asked to take essential measures.

In past pandemics, people started to drop their life-saving behavioural changes as the risk seemed to become routine, even as the actual danger increased.

This is not inevitable, because in some places, and in some outbreaks, people managed to stick with them.

We can be like the folks who stuck with these strange new rituals, who didn’t let their guard down, and who saved the lives of countless people they never met.

The Choice Engine

A project I’ve been working on a for a long time has just launched:

By talking to the @ChoiceEngine twitter-bot you can navigate an essay about choice, complexity and the nature of our minds. Along the way I argue why the most famous experiment on the neuroscience of free will doesn’t really tell us much, and discuss the wasp which made Darwin lose his faith in a benevolent god. And there’s this animated gif:

Follow and tweet START @ChoiceEngine to begin

After the methods crisis, the theory crisis

This thread started by Ekaterina Damer has prompted many recommendations from psychologists on twitter.

Here are most of the recommendations, with their recommender in brackets. I haven’t read these, but wanted to collate them in one place. Comments are open if you have your own suggestions.

(Iris van Rooij)
“How does it work?” vs. “What are the laws?” Two conceptions of psychological explanation. Robert Cummins

(Ed Orehek)
Theory Construction in Social Personality Psychology: Personal Experiences and Lessons Learned: A Special Issue of Personality and Social Psychology Review

(Djouria Ghilani)
Personal Reflections on Theory and Psychology
Gerd Gigerenzer,

Selected Works of Barry N. Markovsky

(pretty much everyone, but Tal Yarkoni put it like this)
“Meehl said most of what there is to say about this”

  • Theory-testing in psychology and physics: A methodological paradox
  • Appraising and amending theories: The strategy of Lakatosian defense and two principles that warrant it
  • Why summaries of research on psychological theories are often uninterpretable
  • (Which reminds me, PsychBrief has been reading Meehl and provides extensive summaries here: Paul Meehl on philosophy of science: video lectures and papers)

    (Burak Tunca)
    What Theory is Not by Robert I. Sutton & Barry M. Staw

    (Joshua Skewes)
    Valerie Gray Hardcastle’s “How to build a theory in cognitive science”.

    (Randy McCarthy)
    Chapter 1 of Gawronski, B., & Bodenhausen, G. V. (2015). Theory and explanation in social psychology. Guilford Publications.

    (Kimberly Quinn)
    McGuire, W. J. (1997). Creative hypothesis generating in psychology: Some useful heuristics. Annual review of psychology, 48(1), 1-30.

    (Daniël Lakens)
    Jaccard, J., & Jacoby, J. (2010). Theory Construction and Model-building Skills: A Practical Guide for Social Scientists. Guilford Press.

    Fiedler, K. (2004). Tools, toys, truisms, and theories: Some thoughts on the creative cycle of theory formation. Personality and Social Psychology Review, 8(2), 123–131.

    (Tom Stafford)
    Roberts and Pashler (2000). How persuasive is a good fit? A comment on theory testing

    From the discussion it is clear that the theory crisis will be every bit as rich and full of dissent as the methods crisis.

    Updates 16 August 2018

    (Richard Prather)
    Simmering et al (2010). To Model or Not to Model? A Dialogue on the Role of Computational Modeling in Developmental Science

    (Brett Buttliere: we made a Facebook group to talk about theory)
    Psychological Theory Discussion Group

    (Eric Morris)
    Wilson, K. G. (2001). Some notes on theoretical constructs: types and validation from a contextual behavioral perspective

    (Michael P. Grosz)
    Theoretical Amnesia by Denny Borsboom

    (Ivan Grahek)
    Fiedler (2017). What Constitutes Strong Psychological Science? The (Neglected) Role of Diagnosticity and A Priori Theorizing

    (Iris van Rooij)
    More suggestions in these two theads (one, two)

    Open Science Essentials: Preprints

    Open science essentials in 2 minutes, part 4

    Before a research article is published in a journal you can make it freely available for anyone to read. You could do this on your own website, but you can also do it on a preprint server, such as psyarxiv.com, where other researchers also share their preprints, which is supported by the OSF so will be around for a while, and which allows you to find others’ research easily.

    Preprint servers have been used for decades in physics, but are now becoming more common across academia. Preprints allow rapid dissemination of your research, which is especially important for early career researchers. Preprints can be cited and indexing services like Google Scholar will join your preprint citations with the record of your eventual journal publication.

    Preprints also mean that work can be reviewed (and errors-caught) before final publication.

    What happens when my paper is published?

    Your work is still available in preprint form, which means that there is a non-paywalled version and so more people will read and cite it. If you upload a version of the manuscript after it has been accepted for publication that is called a post-print.

    What about copyright?

    Mostly journals own the formatted, typeset version of your published manuscript. This is why you often aren’t allowed to upload the PDF of this to your own website or a preprint server, but there’s nothing stopping you uploading a version with the same text (so the formatting will be different, but the information is the same).

    Will journals refuse my paper if it is already “published” via a preprint?

    Most journals allow, or even encourage preprints. A diminishing minority don’t. If you’re interested you can search for specific journal policies here.

    Will I get scooped?

    Preprints allow you to timestamp your work before publication, so they can act to establish priority on a findings which is protection against being scooped. Of course, if you have a project where you don’t want to let anyone know you are working in that area until you’re published, preprints may not be suitable.

    When should I upload a preprint?

    Upload a preprint at the point of submission to a journal, and for each further submission and upon acceptance (making it a postprint).

    What’s to stop people uploading rubbish to a preprint server?

    There’s nothing to stop this, but since your reputation for doing quality work is one of the most important things a scholar has I don’t recommend it.

    Useful links:

    Part of a series:

    1. Pre-registration
    2. The Open Science Framework
    3. Reproducibility

    Believing everyone else is wrong is a danger sign

    I have a guest post for the Research Digest, snappily titled ‘People who think their opinions are superior to others are most prone to overestimating their relevant knowledge and ignoring chances to learn more‘. The paper I review is about the so-called “belief superiority” effect, which is defined by thinking that your views are better than other people’s (i.e. not just that you are right, but that other people are wrong). The finding that people who have belief superiority are more likely to overestimate their knowledge is a twist on the famous Dunning-Kruger phenomenon, but showing that it isn’t just ignorance that predicts overconfidence, but also the specific belief that everyone else has mistaken beliefs.

    Here’s the first lines of the Research Digest piece:

    We all know someone who is convinced their opinion is better than everyone else’s on a topic – perhaps, even, that it is the only correct opinion to have. Maybe, on some topics, you are that person. No psychologist would be surprised that people who are convinced their beliefs are superior think they are better informed than others, but this fact leads to a follow on question: are people actually better informed on the topics for which they are convinced their opinion is superior? This is what Michael Hall and Kaitlin Raimi set out to check in a series of experiments in the Journal of Experimental Social Psychology.

    Read more here: ‘People who think their opinions are superior to others are most prone to overestimating their relevant knowledge and ignoring chances to learn more


    Review: John Bargh’s “Before You Know It”

    I have a review of John Bargh’s new book “Before You Know It: The Unconscious Reasons We Do What We Do” in this month’s Psychologist magazine. You can read the review in print (or online here) but the magazine could only fit in 250 words, and I originally wrote closer to 700. I’ll put the full, unedited, review below at the end of this post.

    John Bargh is one of the world’s most celebrated social psychologists, and has made his name with creative experiments supposedly demonstrating the nature of our unconscious minds. His work, and style of work, has been directly or implicitly criticised during the so-called replication crisis in psychology (example), so I approached a book length treatment of his ideas with interest, and in anticipation of how he’d respond to his critics.

    Full disclosure: I’ve previously argued that Bargh’s definition of ‘unconscious’ is theoretically incoherent, rather than merely empirically unreliable, so my prior expectations for his book are probably best classified as ‘skeptical’. I did get a free copy though, which always puts me in a good mood.

    If you like short and sweet, please pay The Psychologist a visit for the short review. If you’ve patience for more of me (and John Bargh), read on….

    Continue reading “Review: John Bargh’s “Before You Know It””

    Did the Victorians have faster reactions?

    Psychologists have been measuring reaction times since before psychology existed, and they are still a staple of cognitive psychology experiments today. Typically psychologists look for a difference in the time it takes participants to respond to stimuli under different conditions as evidence of differences in how cognitive processing occurs in those conditions.

    Galton, the famous eugenicist and statistician, collected a large data set (n=3410) of so called ‘simple reaction times’ in the last years of the 19th century.  Galton’s interest was rather different from most modern psychologists – he was interested in measures of reaction time as a indicator of individual differences. Galton’s theory was that differences in processing speed might underlie differences in intelligence, and maybe those differences could be efficiently assessed by recording people’s reaction times.

    Galton’s data creates an interesting opportunity – are people today, over 100 years later, faster or slower than Galton’s participants? If you believe Galton’s theory, the answer wouldn’t just tell you if you would be likely to win in a quick-draw  contest with a Victorian gunslinger, it could also provide an insight into generational changes in cognitive function more broadly.

    Reaction time [RT] data provides an interesting counterpoint to the most famous historical change in cognitive function – the generation on generation increase in IQ scores, known as the Flynn Effect. The Flynn Effect surprises two kinds of people – those who look at “kids today” and know by instinct that they are less polite, less intelligent and less disciplined their own generation (this has been documented in every generation back to at least Ancient Greece), and those who look at kids today and know by prior theoretical commitments that each generation should be dumber than the previous (because more intelligent people have fewer children, is the idea).

    Whilst the Flynn Effect contradicts the idea that people are getting dumber, some hope does seem to lie in the reaction time data. Maybe Victorian participants really did have faster reaction times! Several research papers  (1, 2) have tried to compare Galton’s results to more modern studies, some of which tried to use the the same apparatus as well as the same method of measurement. Here’s Silverman (2010):

    the RTs obtained by young adults in 14 studies published from 1941 on were compared with the RTs obtained by young adults in a study conducted by Galton in the late 1800s. With one exception, the newer studies obtained RTs longer than those obtained by Galton. The possibility that these differences in results are due to faulty timing instruments is considered but deemed unlikely.
    Woodley et al (2015) have a helpful graph (Galton’s result shown on the bottom left):

    (Woodley et al, 2015, Figure 1, “Secular SRT slowing across four large, representative studies from the UK spanning a century. Bubble-size is proportional to sample size. Combined N = 6622.”)

    So the difference is only ~20 milliseconds (i.e. one fiftieth of a second) over 100 years, but in reaction time terms that’s a hefty chunk – it means modern participants are about 10% slower!

    What are we to make of this? Normally we wouldn’t put much weight on a single study, even one with 3000 participants, but there aren’t many alternatives. It isn’t as if we can have access to young adults born in the 19th century to check if the result replicates. It’s a shame there aren’t more intervening studies, so we could test the reasonable prediction that participants in the 1930s should be about halfway between the Victorian and modern participants.

    And, even if we believe this datum, what does it mean? A genuine decline in cognitive capacity? Excess cognitive load on other functions? Motivational changes? Changes in how experiments are run or approached by participants? I’m not giving up on the kids just yet.

    References:

    spaced repetition & Darwin’s golden rule

    Spaced repetition is a memory hack. We know that spacing out your study is more effective than cramming, but using an app you can tailor your own spaced repetition schedule, allowing you to efficiently create reliable memories for any material you like.

    Michael Nielsen, has a nice thread on his use of spaced repetition on twitter:

    He covers how he chooses what to put into his review system, what the right amount of information is for each item, and what memory alone won’t give you (understanding of the process which uses the memorised items). Nielsen is pretty enthusiastic about the benefits:

    The single biggest change is that memory is no longer a haphazard event, to be left to chance. Rather, I can guarantee I will remember something, with minimal effort: it makes memory a  choice.

    There are lots of apps/programmes which can help you run a spaced repetition system, but Nielsen used Anki (ankiweb.net), which is open source, and has desktop and mobile clients (which sync between themselves, which is useful if you want to add information while at a computer, then review it on your mobile while you wait in line for coffee or whatever).

    Checking Anki out, it seems pretty nice, and I’ve realised I can use it to overcome a cognitive bias we all suffer from: a tendency to forget facts which are an inconvenient for our beliefs.

    Charles Darwin notes this in his autobiography:

    “I had, also, during many years, followed a golden rule, namely, that whenever a published fact, a new observation or thought came across me, which was opposed to my general results, to make a memorandum of it without fail and at once; for I had found by experience that such facts and thoughts were far more apt to escape from the memory than favourable ones. Owing to this habit, very few objections were raised against my views which I had not at least noticed and attempted to answer.”

    (Darwin, 1856/1958, p123).

    I have notebooks, and Darwin’s habit of forgetting “unfavourable” facts, but I wonder if my thinking might be improved by not just noting the facts, but being able to keep them in memory – using a spaced repetition system. I’m going to give it a go.

    Links & Footnotes:

    Anki app (ankiweb.net)

    Wikipedia on space repetition systems

    The Autobiography of Charles Darwin, 1809–1882, edited by Nora Barlow. London: Collins

    For more on the science, see this recent review for educators: Weinstein, Y., Madan, C. R., & Sumeracki, M. A. (2018). Teaching the science of learning. Cognitive research: principles and implications, 3(1), 2.

    I note that Anki-based spaced repetition also does a side serving of retrieval practice and interleaving (other effective learning techniques).

    A graph that is made by perceiving it

    The contrast sensitivity function shows how our sensitivity to contrasts is affected by spatial frequency. You can test it using gratings of alternating light and darker shade. Ian Goodfellow has this neat observation:

    It’s a graph that makes itself! The image is the raw data, and by interacting with your visual system, you perceive a discontinuity which illustrates the limits of your perception.

    Spatial frequency means how often things change in space. High spatial frequency changes means lots of small detail.  Spatial frequency is surprisingly important to our visual system – lots of basic features of the visual world, like orientation or motion, are processed first according to which spatial frequency the information is available at.

    Spatial frequency is behind the Einstein-Marilyn illusion, whereby you see Albert Einstein if the image is large or close up, and Marilyn Monroe if the image is small / seen from a distance (try it! You’ll have to walk away from your screen to see it change).

    The Einstein Monroe was created by Dr. Aude Oliva at MIT for the March 31st 2007 issue of New Scientist magazine

    Depending on distance, different spatial frequencies are easier to see, and if those spatial frequencies encode different information then you can make a hybrid image which switches as you alter your distance from it.

    Spatial frequency is also why, when you’re flying over the ocean, you can see waves which appear not to move. Although you vision is sensitive enough to see the wave, the motion sensitive part of your visual system isn’t as good at the fine spatial frequencies – which creates a natural illusion of static waves.

    The contrast sensitivity image at the head of this post varies contrast top to bottom (low to high) and spatial frequency left to right (low to high). The point at which the bars stop looking distinct picks out a ridge which rises (to a maximum at about about 10 cycles per degrees of angle) and then drops off. Where this ridge is will vary depending on your particular visual system and what distance you view the image at. It is the ultimate individualised data visualisation – it picks out the particular sensitivity of your own visual system, in real time. It’s even interactive, instantly adjusting for momentary changes in parameters like brightness!

    More on hybrid images (including some neat examples): Oliva, A., Torralba, A., & Schyns, P. G. (2006, July). Hybrid images. In ACM Transactions on Graphics (TOG) (Vol. 25, No. 3, pp. 527-532). ACM.

    More on the visual system, including the contrast sensitivity function: Frisby, J. P., & Stone, J. V. (2010). Seeing: The computational approach to biological vision. The MIT Press.

    How To Become A Centaur

    Nicky Case (of Explorable Explanations and Parable of the Polygons internet fame) has a fantastic essay which picks up on the theme of my last Cyberselves post – technology as companion, not competitor.

    In How To Become A Centaur Case gives blitz history of AI, and of its lesser known cousin IA – Intelligence Augmentation. The insight that digital technology could be a a ‘bicycle for the mind’ (Steve Jobs’ quote) gave us the modern computer, as shown in the 1968 Mother of All Demos which introduced the world to the mouse, hypertext, video conferencing and collaborative working. (1968 people! 1968! As Case notes, 44 years before google docs, 35 years before skype).

    We’re living in the world made possible by Englebart’s demo. Digital tools, from mere phones to the remote presence they enable, or the remote action that robots are surely going to make more common, and as Case says:

    a tool doesn’t “just” make something easier — it allows for new, previously-impossible ways of thinking, of living, of being.

    And the vital insight is that the future will rely on identifying the strengths and weakness of natural and artificial cognition, and figuring out how to harness them together. Case again:

    When you create a Human+AI team, the hard part isn’t the “AI”. It isn’t even the “Human”.

    It’s the “+”.

    The article is too good to try to summarise. Read the full text here

    Cross-posted at the Cyberselves blog.

    Previously: Tools, substitutes or companions: three metaphors for thinking about technology, Cyberselves: How Immersive Technologies Will Impact Our Future Selves

    Debating Sex Differences: Talk transcript

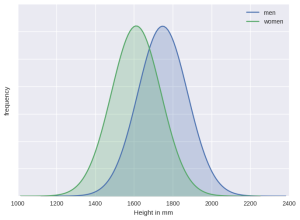
    A talk I gave titled “Debating Sex Differences in Cognition: We Can Do Better” now has a home on the web.

    The pages align a rough transcript of the talk with the slides, for your browsing pleasure.

    Mindhacks.com readers will recognise many of the slides, which started their lives as blog posts. The full series is linked from this first post: Gender brain blogging. The whole thing came about because I was teaching a graduate discussion class on Cordelia Fine’s book, and then Andrew over at psychsciencenotes invited me to give a talk about it.

    Here’s a bit from the introduction:

    I love Fine’s book. I think of it as a sort of Bad Science but for sex differences research. Part of my argument in this talk is that Fine’s book, and reactions to it, can show us something important about how psychology is conducted and interpreted. The book has flaws, and some people hate it, and those things too are part of the story about the state of psychological research.

    More here

    The backfire effect is elusive

    The backfire effect is when correcting misinformation hardens, rather than corrects, someone’s mistaken belief. It’s a relative of so called ‘attitude polarisation’ whereby people’s views on politically controversial topics can get more, not less, extreme when they are exposed to counter-arguments.

    The finding that misperception are hard to correct is not new – it fits with research on the tenacity of beliefs and the difficulty of debunking.

    The backfire effect appears to give an extra spin on this. If backfire effects hold, then correcting fake news can be worse than useless – the correction could reinforce the misinformation in people’s minds. This is what Brendan Nyhan and Jason Reifler warned about in a 2010 paper ‘When Corrections Fail: The Persistence of Political Misperceptions’.

    Now, work by Tom Wood and Ethan Porter suggests that backfire effects may not be common or reliable. Reporting in their ‘The Elusive Backfire Effect: Mass Attitudes’ Steadfast Factual Adherence’ they exposed over 10,000 mechanical turk participants, over 5 experiments and 52 different topics, to misleading statements from American politicians from both of the two main parties. Across all statements, and all experiments, they found that showing people corrections moved their beliefs away from the false information. There was an effect of the match between the ideology of the participant and of the politician, but it wasn’t large:

    Among liberals, 85% of issues saw a significant factual response to correction, among moderates, 96% of issues, and among conservatives, 83% of issues. No backfire was observed for any issue, among any ideological cohort

    All in all, this suggests, in their words, that ‘The backfire effect is far less prevalent than existing research would indicate’. Far from being counter-productive, corrections work. Part of the power of this new study is that it uses the same materials and participants as the 2010 paper reporting backfire effects – statements about US politics and US citizens. Although the numbers mean the new study in convincing, it doesn’t show the backfire effect will never occur, especially for different attitudes in different contexts or nations.

    So, don’t give up on fact checking just yet – people are more more reasonable about their beliefs than the backfire suggests.

    Original paper: Nyhan, B., & Reifler, J. (2010). When corrections fail: The persistence of political misperceptions. Political Behavior, 32(2), 303-330.

    New studies: Wood, T., & Porter, E. (in press). The elusive backfire effect: Mass attitudes’ steadfast factual adherence. Political Behaviour.

    The news is also good in a related experiment on fake news by the same team: Sex Trafficking, Russian Infiltration, Birth Certificates, and Pedophilia: A Survey Experiment Correcting Fake News. Regardless of ideology or content of fake news, people were responsive to corrections.

    Read more about the psychology of responsiveness to argument in my ‘For argument’s sake: evidence that reason can change minds’.

    Open Science Essentials: Reproducibility

    Open science essentials in 2 minutes, part 3

    Let’s define it this way: reproducibility is when your experiment or data analysis can be reliably repeated. It isn’t replicability, which we can define as reproducing an experiment and subsequent analysis and getting qualitatively similar results with the new data. (These aren’t universally accepted definitions, but they are common, and enough to get us started).

    Reproducibility is a bedrock of science – we all know that our methods section should contain enough detail to allow an independent researcher to repeat our experiment. With the increasing use of computational methods in psychology, there’s increasing need – and increasing ability – for us to share more than just a description of our experiment or analysis.

    Reproducible methods

    Using sites like the Open Science Framework you can share stimuli and other materials. If you use open source experiment software like PsychoPy or Tatool you can easily share the full scripts which run your experiment and people on different platforms and without your software licenses can still run your experiment.

    Reproducible analysis

    Equally important is making your analysis reproducible. You’d think that with the same data, another person – or even you in the future – would get the same results. Not so! Most analyses include thousands of small choices. A mis-step in any of these small choices – lost participants, copy/paste errors, mis-labeled cases, unclear exclusion criteria – can derail an analysis, meaning you get different results each time (and different results from what you’ve published).

    Fortunately a solution is at hand! You need to use analysis software that allows you to write a script to convert your raw data into your final output. That means no more Excel sheets (no history of what you’ve done = very bad – don’t be these guys) and no more point-and-click SPSS analysis.

    Bottom line: You must script your analysis – trust me on this one

    Open data + code

    You need to share and document your data and your analysis code. All this is harder work than just writing down the final result of an analysis once you’ve managed to obtain it, but it makes for more robust analysis, and allows someone else to reproduce your analysis easily in the future.

    The most likely beneficiary is you – you most likely collaborator in the future is Past You, and Past You doesn’t answer email. Every analysis I’ve ever done I’ve had to repeat, sometimes years later. It saves time in the long run to invest in making a reproducible analysis first time around.

    Further Reading

    Nick Barnes: Publish your computer code: it is good enough

    British Ecological Society: Guide to Reproducible Code

    Gael Varoquaux : Computational practices for reproducible science

    Advanced

    Reproducible Computational Workflows with Continuous Analysis

    Best Practices for Computational Science: Software Infrastructure and Environments for Reproducible and Extensible Research

    Part of a series for graduate students in psychology.
    Part 1: pre-registration.
    Part 2: the Open-Science Framework.

    Part 3: Reproducibility

    The Human Advantage

    In ‘The Human Advantage: How Our Brains Became Remarkable’, Suzana Herculano-Houzel weaves together two stories: the story of her scientific career, based on her invention of a new technique for counting the number of brain cells in an entire brain, and the story of human brain evolution.

    Previously counts of neurons in brains of humans and other animals relied on sampling: counting the cells in a slice of tissue and multiplying up to get an estimate. Because of differences in cell types and numbers across brain regions, these estimates are uncertain. Herculano-Houzel’s technique involves liquidizing a whole brain or brain region so that a sample of this homogeneous mass can yield reliable estimates of total cell count. Herculano-Houzel calls it “brain soup”.

    The Human Advantage is the story of her discovery and the collaborations that led her to apply the technique to rodent, primate and human brains, and eventually to everything from giraffes to elephants.

    Along the way she made various discoveries that contradict received wisdom in neuroscience:
    most species (including rodents primates) have 80% of the neurons in the cerebellum
    humans have about 86 billion neurons (16.3 billion in cerebral cortex), which is a missing 14 billion neurons compared to the conventional estimate.
    – you can’t compare brain size to count brain cells. Because the cell volume changes with body size, some species with bigger brains have fewer neurons, and species with the same size brains can have vastly different neuron counts.

    Example 1
    * The capybara (a rodent), cerebral cortex has a weight of 48.2g and 306 million neurons
    * The bonnet monkey (a primate), cerebral cortex has a weight of 48.3g and 1.7 billion neurons

    Example 2
    * African elephant, body mass 5000 kg, brain mass 4619g, 5.6 billion cerebral cortex neurons
    * Human, body mass 70 kg, brain mass 1509g, 16.3 billion cerebral cortex neurons

    (Fun fact:elephant neurons are 98% in the cerebellum – possibly because of the evolution of the trunk).

    A lot of the book is concerned with relative as well as absolute numbers of brain cells. A frequent assumption is that humans must have more cortex relative to the rest of their brain, or more prefrontal cortex relative to the rest of the cortex. This is not true, says Herculano-Houzel’s research. The exception in nature is primates, who show a greater density of neurons per gram of brain mass and more energetically efficient neurons in terms of metabolic requirement per neuron. Humans are no exception to the scaling laws that govern primates, but we are particularly large (a caveat is great apes, who have larger bodies than us, but smaller brains, departing from the body-brain scaling law that govern humans and other primates). Our cognitive exceptionalism is based on raw number of brain cells in the cortex – that’s the human advantage.

    This is a book which blends a deep look into comparative neuroanatomy and the evolutionary story of the brain with the specific research programme of one scientist. It shows how much progress in science depends on technological innovation, hard work, a bit of luck, social connections and thoughtful integration of the ideas of others. A great book – mindhacks.com recommends!